Magnetic Resonance Imaging-Based Volumetric Analysis and Its Relationship to Actual Breast Weight
Article information
Abstract
Background
Preoperative volume assessment is useful in breast reconstruction. Magnetic resonance imaging (MRI) and mammography are commonly available to reconstructive surgeons in the care of a patient with breast cancer. This study aimed to verify the accuracy of breast volume measured by MRI, and to identify any factor affecting the relationship between measured breast volume and actual breast weight to derive a new model for accurate breast volume estimation.
Methods
From January 2012 to January 2013, a retrospective review was performed on a total of 101 breasts from 99 patients who had undergone total mastectomy. The mastectomy specimen weight was obtained for each breast. Mammographic and MRI data were used to estimate the volume and density. A standard statistical analysis was performed.
Results
The mean mastectomy specimen weight was 340.8 g (range, 95 to 795 g). The mean MRI-estimated volume was 322.2 mL3. When divided into three groups by the "difference percentage value", the underestimated group showed a significantly higher fibroglandular volume, higher percent density, and included significantly more Breast Imaging, Reporting and Data System mammographic density grade 4 breasts than the other groups. We derived a new model considering both fibroglandular tissue volume and fat tissue volume for accurate breast volume estimation.
Conclusions
MRI-based breast volume assessment showed a significant correlation with actual breast weight; however, in the case of dense breasts, the reconstructive surgeon should note that the mastectomy specimen weight tends to overestimate the volume. We suggested a new model for accurate breast volume assessment considering fibroglandular and fat tissue volume.
INTRODUCTION
In breast reconstruction, the principle aesthetic objective is the restoration of volumetric symmetry. Accurate volume assessment is a prerequisite in preoperative planning as well as an important consideration during the intraoperative decision making process. The weight of a preoperative breast, in addition to its volume, is also relevant to the issue of symmetry. The weight or volume of the breast is the most readily available information for patients who have undergone mastectomy; this same information is most useful for the reconstructive surgeon who is faced with the task of contouring an abdominal free flap or choosing a breast implant. For patients undergoing mastectomy, the reconstructive surgeon has the weight of the mastectomy specimen at the time of surgery for immediate reconstruction. However, in delayed reconstruction, the reconstructive surgeon needs to calculate the contralateral side breast volume.
Various modes of preoperative breast volume assessment have been published in the past [1-5]. Traditionally, anthropometry -volume estimation with basic measurements of breast dimensions- has been the standard. In the more recent past, volumetric analysis with ultrasonography, mammography, computed tomography, magnetic resonance imaging (MRI), and 3-dimensional (3D) scanners has been on the rise [6,7]. The preoperative imaging data, obtained as part of the cancer staging workup like mammography, computed tomography (CT), or MRI, is available to reconstructive surgeons for delayed reconstruction. This advantage also holds true for those cases in which a patient has undergone a breast conserving operation and presents for a completion mastectomy with immediate reconstruction.
In spite of numerous methods of volumetric assessment, there still exist some gaps between image-based volumetric estimation and actual breast weight. The aim of this study was to verify the accuracy of breast volume estimation by MRI and to analyze the factors affecting the relationship between image-based volumetric estimation and actual breast weight. Furthermore, we intended to derive a new model for accurate breast volume assessment.
METHODS
A retrospective review of patient records was performed. The inclusion criteria were for any patients undergoing total mastectomy with immediate reconstruction from January 2012 to January 2013. Of these, any patient who had undergone breast-conserving surgery before mastectomy were excluded. Mastectomy was performed by two senior general surgeons. Standard patient demographic, mastectomy specimen weight, mammogram, and MRI data were collected and analyzed as detailed in this section. For MRI-based volume approximation, adipose-suppressed, T1-weighted sagittal views were used. For each breast, the overall volume and the volume of the fibroglandular tissue of the cancer side breast were measured with a semiautomated process provided by the Medical Image Processing, Analysis, and Visualization (MIPAV) application.
In the first step, the breast tissue boundary was drawn manually on the image with the highest projection. Then, for each sagittal image, the breast tissue boundary was traced automatically. Once the program-generated boundaries had been applied to every slice within the sagittal stack, an operator reviewed and manually revised, if necessary, each boundary drawn; this occurred most commonly in the plane of the pectoral fascia (Fig. 1). The overall breast volume was calculated to be within the set of boundaries across the sagittal stack of images.
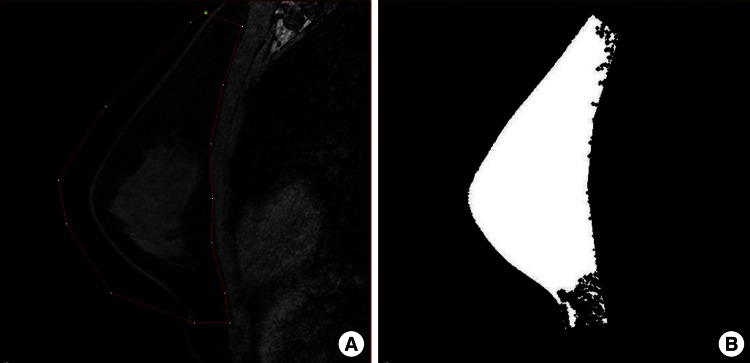
MRI-based breast volume assessment using the MIPAV system
(A) Using the MIPAV system, the breast tissue boundary was drawn manually (red line). The boundary was applied to all slices automatically, and an operator reviewed and manually adjusted the boundary, especially in the plane of the pectoral fascia. (B) Image after volume assessment. MRI, magnetic resonance imaging; MIPAV, Medical Image Processing, Analysis, and Visualization.
Once the overall breast volume had been obtained, fibroglandular tissue was segmented from within each boundary by the use of a fuzzy c-means (FCM) clustering algorithm. The fibroglandular tissue volume was calculated to be the sum of these segments across the sagittal stack, as previously described (Fig. 2) [8-10]. Finally, with both volumes obtained, the breast percent density was calculated as the fibroglandular tissue volume as a proportion of the whole breast tissue. Each measurement (total breast volume, fibroglandular volume, and percent density of the sagittal stack) required approximately 5 to 7 minutes. For all breasts to be analyzed in this study, each measurement was repeated three times by a single surgeon. The mean values of these repeat measurements were used for statistical analysis.
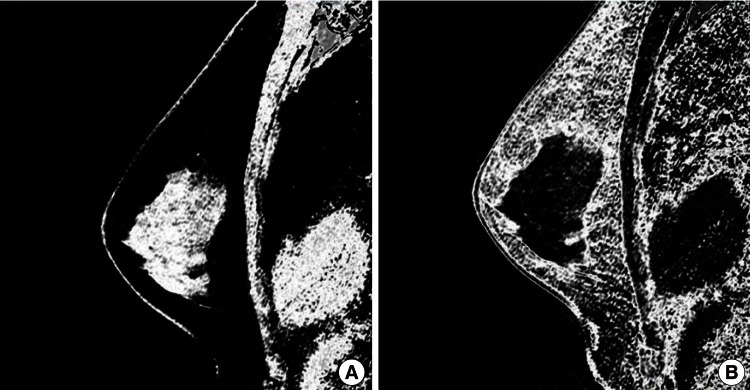
Fibroglandular tissue volume assessment using FCM clustering
Breast tissue segmentation was done using a fuzzy c-means (FCM) clustering algorithm. (A) Through segmentation, the fibroglandular tissue volume was calculated. (B) In same way, the fat tissue volume was calculated.
Mammography data acquisition
The breast density assessment was performed by board-certified radiologists, using the Breast Imaging, Reporting and Data System (BI-RADS). The BI-RADS system is a quality assurance tool originally designed for use with mammography. BI-RADS grade 1 means the breast is almost entirely fat on mammography, grade 2 means the breast has scattered fibroglandular density, grade 3 means the breast is heterogeneously dense, that is, that the glandular portion is more than 50%. Grade 4 means the breast is extremely dense.
Statistical analysis
The overall set of volume measurements was divided into three subgroups. Once this was done, one-way analysis of variance (ANOVA) and the chi-squared test were used to analyze the differences between these subgroups. As a post-analysis, Tukey's test and the Bonferroni correction were performed. After that, we utilized regression analysis to assess the appropriateness of a new model regarding both fibroglandular tissue volumes and fat tissue volumes to predict breast mass. The results of the regression analysis (r2) were compared to the previous model considering only the total breast volume to address the breast mass [7]. All of the statistical tests were regarded as significant at P<0.05. All statistical analyses was performed using SPSS ver. 19.0 (IBM, Armonk, NY, USA).
RESULTS
There were a total of 99 patients in this study. Among them, 97 patients underwent a unilateral mastectomy,-while the other 2 patients received bilateral mastectomies, for a total of 101 breast volumes analyzed. Among 101 breasts, 38 subjects underwent nipple sparing mastectomy, 33 subjects underwent skin sparing mastectomy, and the remaining 30 subjects underwent total mastectomy. According to TNM cancer staging, 7 breasts were stage 0, 41 breasts were stage l, 45 breasts were stage ll, and 8 breasts were stage lll. The median patient age was 42.9 years (range, 25 to 60 years). The mean mastectomy specimen weight was 340.8 g (range, 95 to 795 g). The mean MRI-estimated volume was 322.2 mL3, whereas the mean volume derived from the mammogram was 314.5 mL3. The mean fibroglandular tissue volume, by MRI, was 57.5 mL3 with a mean percent density of 0.20.
As with other breast volume studies previously published [11-13], our analysis was performed with the assumption that, as far as the breast is concerned, its volume would be at a 1:1 ratio with the weight (1 g/mL). Thus, breast volume was defined by the following formula, calculated in the Microsoft excel program:
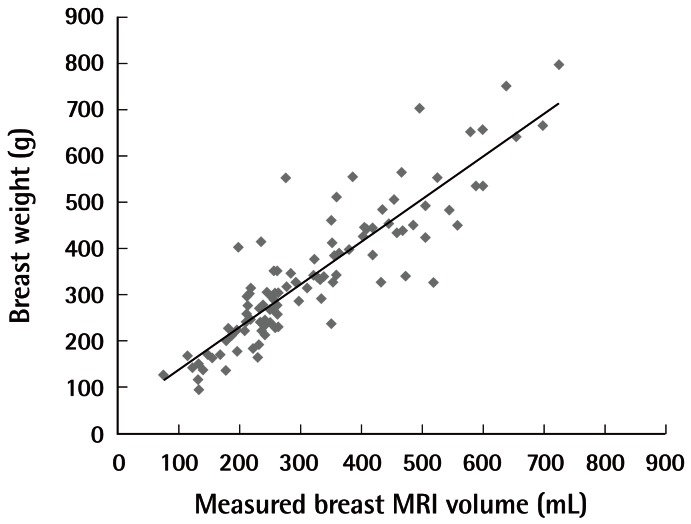
Actual breast weight versus MRI-based volume
The breast volume can be defined by the following formula: total breast weight=(0.93 ×estimated MRI breast volume)+43. MRI, magnetic resonance imaging.
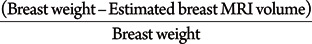
To identify any factors that may cause the calculated breast weight to deviate from the actual measured weight, we have assigned a "difference percentage value" to each of the breasts analyzed. This difference percentage value was defined as the difference between the actual and calculated weight as a proportion of the actual weight:
The absolute mean difference percentage value was 15.3%-meaning that, on average, the difference between the calculated and actual values was 15.3% of the actual breast weight (per mastectomy specimen). Thus, the dataset was classified into three groups, such that group 1 (n=12) included subjects with a difference percentage value less than 15%. Group 2 (n=69) included subjects with a value between -15% and +15%. Group 3 (n=20) included subjects with a value more than +15%.
For each of these groups, the one-way analysis of variance was performed for age, fibroglandular tissue volume, and percent density. Patient age did not appear to significantly affect the difference between the actual and calculated breast weight. However, the fibroglandular tissue volume and percent density did appear to have a significant effect on the difference percentage value (P<0.05) (Table 1).
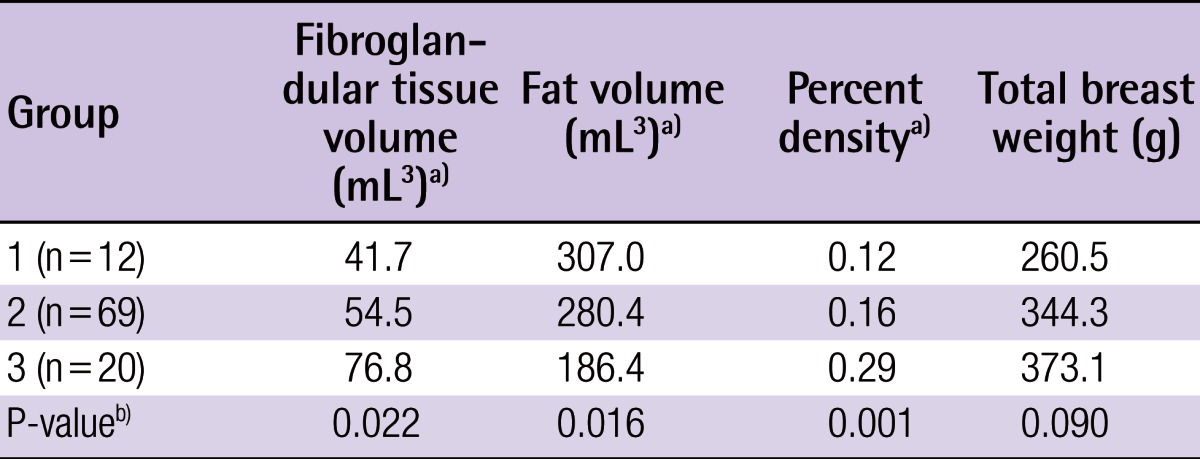
Differences in measurements depending on the "difference percentage value"
Between groups 1 and 3, significant differences in breast weight could be attributed to fibroglandular tissue volume and breast weight. Such a relationship did not exist between groups 1 and 2, nor between groups 2 and 3. In all, group 3 appeared to have significantly less adipose volume and a greater percent density than did the other groups (Table 1).
In mammographic breast density assessment, there were 8, 60, and 34 breasts in the BI-RADS density grades of 2, 3, and 4, respectively. Among the three subgroups mentioned above, Group 3 was revealed to have significantly more BI-RADS mammographic density grade 4 breasts than the others (Table 2). On the basis of this finding, a new formula for breast volume estimation considering fibroglandular tissue (FGT) volume and fat tissue volume was created from regression analysis:
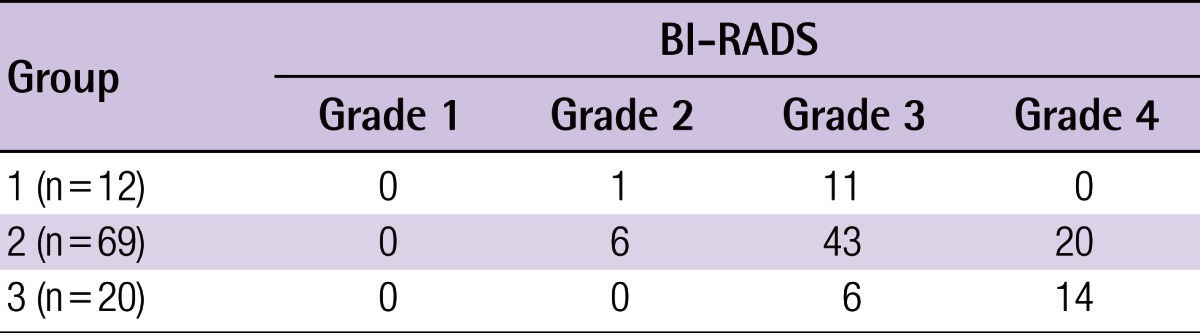
BI-RADS mammographic density grade in three groups (No. of patients)
By regression analysis, the new formula showed a higher R2 value (R2=0.892) than the previous model (R2=0.793), (P< 0.001).
DISCUSSION
In breast reconstruction, preoperative breast volume assessment is helpful to both the surgeon and the patient, as the reconstructive options are under discussion. This is all the more true for those increasing numbers of patients with breast cancer who must undergo a mastectomy and reconstruction, as well as for patients who have elected to undergo a delayed reconstruction upon initial mastectomy [14]. Thus, having information about preoperative volume symmetry is of high utility for the surgeon who is charged with the task of reconstructing a breast that has undergone a cancer operation already and which, upon a physical examination, does not readily reveal the original breast volume besides what could be crudely measured from the contralateral breast. Additionally, for reconstructive surgeons who offer the option of free flap reconstruction, knowing the preoperative breast volume and/or weight is extremely helpful in deciding how much of a flap to elevate in order to restore the proper volume.
In the past three decades, accurate breast volume measurement had been a constant focus in the aesthetic and breast surgery literature. The methods published so far include anthropometry, ultrasonography, mammography, computed tomography, Archimedean methods (liquid volume displacement), thermoplastic methods, magnetic resonance imaging, and variations of light-based 3D scanners [1-7]. In breast cancer, mammography, chest CT, and MRI are in increasing use as recommended by various national standards and guidelines for cancer management practices. The original purposes of these imaging modalities are diagnosis and staging of a breast neoplasm, yet, when patients present to the reconstructive clinic, these imaging studies can serve as adjuncts to physical examination. The use of these preoperative images incurs no additional financial obligation to either the patient or society at large and allows the reconstructive surgeon to see the patient as she was before a breast conserving surgery. Ultrasonography has some limitations: the effect of patients' motion during examination and lack of objectivity and reproducibility. Chest CT does not reflect breast shape well due to the supine position and presents the risk of radiation exposure. Breast MRI is known as a modality that has the highest correlation with actual breast volume [15] and can provide more accurate volumetric data with the prone position. Delayed reconstruction patients also have undergone breast MRI previously for breast cancer surgery, so the surgeon can assess breast volume even in cases of delayed reconstruction. We, therefore, decided to use MRI for breast volumetry, and we aimed to identify the factors that affect the relationship between the measured breast volume and actual breast weight.
In several studies, the weight of intraoperative mastectomy specimens have been reported to be close approximations of resected breast volume [11-13]. Common sense dictates that breast weight could be estimated by multiplying the breast volume by a density coefficient. The difficulty in calculating actual breast weight from volume lies with the considerable spectrum along which the fibroglandular-to-adipose ratio (reflected by percent density) could change.
This issue of breast density is the most evident in group 3, in which the estimation of breast volume, using actual weight, was severely underestimated. Both on MRI and mammographic assessment, the breasts in that group were dense. On MRI, they had a higher percent density value, and on mammography, there was a larger proportion of BI-RADS density grade 4 breasts. Considering the increased density in this group, it is no surprise that the calculated volume had been underestimated by 17%. Based on these findings, we concluded that actual weight underestimated breast volume when considering dense breasts with a higher proportion of fibroglandular tissue.
There exist linear trends in estimating breast volume with a single variable of total breast volume measured by MRI, which can be presented as follows:
Through regression analysis, a new model for estimating breast volume could be derived considering both fibroglandular tissue volume and fat tissue volume as follows:
This new model reflects the effect of the fibroglandular tissue portion and fat tissue portion in the breast, reflecting the breast density in estimating the breast volume.
The main limitation of this study is the number of subjects, so with further evaluation, a more accurate model could be derived in the future.
In addition, breast asymmetry is not an unusual finding. We used ipsilateral breast volume data in evaluating the required breast volume to compare the actual breast weight and breast volume. However, contralateral breast volume might be more useful for symmetric breast reconstruction intraoperatively. The breast volume estimation formula we suggested above might have to be used to estimate the contralateral breast volume in a clinical setting. Further study that reveals the differences in bilateral breast volume data would be a valuable reference.
To the best of our knowledge, this is the first study that analyzes the factors affecting the relationship between actual breast weight and measured breast volume. Our findings suggest a volume assessment formula that should reflect breast density. We believe that, for patients who have BI-RADS density grade 4 breasts or a high percent density on MRI, it is possible to underestimate the required reconstructive volume. The new model we suggested above could help estimating breast volume more accurately.
Notes
No potential conflict of interest relevant to this article was reported.