Normative Measurements of Grip and Pinch Strengths of 21st Century Korean Population
Article information
Abstract
Background
Measuring grip and pinch strength is an important part of hand injury evaluation. Currently, there are no standardized values of normal grip and pinch strength among the Korean population, and lack of such data prevents objective evaluation of post-surgical recovery in strength. This study was designed to establish the normal values of grip and pinch strength among the healthy Korean population and to identify any dependent variables affecting grip and pinch strength.
Methods
A cross-sectional study was carried out. The inclusion criterion was being a healthy Korean person without a previous history of hand trauma. The grip strength was measured using a Jamar dynamometer. Pulp and key pinch strength were measured with a hydraulic pinch gauge. Intra-individual and inter-individual variations in these variables were analyzed in a standardized statistical manner.
Results
There were a total of 336 healthy participants between 13 and 77 years of age. As would be expected in any given population, the mean grip and pinch strength was greater in the right hand than the left. Male participants (137) showed mean strengths greater than female participants (199) when adjusted for age. Among the male participants, anthropometric variables correlated positively with grip strength, but no such correlations were identifiable in female participants in a statistically significant way.
Conclusions
Objective measurements of hand strength are an important component of hand injury evaluation, and population-specific normative data are essential for clinical and research purposes. This study reports updated normative hand strengths of the South Korean population in the 21st century.
INTRODUCTION
Grip and pinch strength are standard constructs of overall hand function. Testing of such strength is simple and inexpensive and is frequently performed to evaluate outcomes following upper extremity injuries [1,2]. In addition, hand strength levels provide validated assessments of a patient's general functional index and the nutritional indices among inpatients receiving nutritional intervention [3-6].
In most assessments of strength in hand injury patients, the contralateral non-injured hand serves as a control [7]. Though such intra-individual comparisons are pragmatic, the interpretation of such data could be questioned from a scientific point of view.
Even among healthy individuals, as might be expected, self-assessment of strength varies from the dominant to non-dominant hand, which has been validated by Massy-Westropp et al. [8], who have reported variations in intra-individual hand strengths to be great and virtually universal. However, another study [9] on normative hand strength has revealed that hand dominance has varying correlations with the types of strength measured.
Grip and pinch strength is generally influenced by the health status and level of physical activity of a person [10,11]. The type of occupation appears to have a specific correlation to the degree of strength exhibited [12], and a recent study in the Chinese population [13] has found a correlation between grip strength and anthropometric factors such as forearm circumference, body height, and weight.
Presently, such normative data regarding hand strength is not available for the Korean population. Evaluation of strength recovery in hand injury patients in this population varies greatly in both intra- and inter-individual comparisons. Consequently, strength assessments in postoperative hand patients are subjective at best. Thus, this study was designed to characterize and establish baseline hand strength values and to determine what patient-related factors might influence hand strength in the healthy Korean population.
METHODS
Subjects
The subjects in this study were recruited from patients who were visiting our institution for normal health screening visits. The inclusion criteria were as follows: any Korean person, of either sex, and older than 10 years of age. Exclusion criteria were any history of 1) inflammatory disease or 2) neurologic disease or 3) traumatic event to the upper extremity requiring medical management or leading to restrictions of daily activity.
Study protocol
All surveys and hand strength assessments were administered by a single researcher. Each potential research subject was given a paper survey to obtain demographic information, hand dominance (i.e., the writing hand), and medical history. If a patient satisfied the inclusion and exclusion criteria, the following anthropometric measurements were taken as previously reported in an anthropometric study of a Caucasian population [14]: 1) hand width (measured at the level of the distal palmar crease), 2) hand length (distal wrist crease to the tip of the longest finger), 3) forearm length (lateral humeral epicondyle to radial styloid process), and 4) forearm circumference (measured to include the midpoint of the forearm length). Total body weight and height were measured with standard scales.
Grip strength was measured with a Jamar hand dynamometer, and both of the pinch strengths were measured with a Jamar hydraulic pinch gauge (Patterson Medical, Bolingbrook, IL, USA). For each of the strength assessments, subjects were seated with the shoulder adducted and neutrally rotated, elbow flexed at 90° with the forearm in neutral position, and wrists between 0° and 30° of flexion and between 0° and 15° of ulnar deviation [15]. Each test was performed three consecutive times at 1-minute intervals to reduce measurement bias due to fatigue [16].
Data analysis
Descriptive statistics (mean and standard deviation) were performed for all direct measurements and derived variables. An independent t-test was used for intra- and inter-group comparisons between males and females. Data were analyzed using the SPSS ver. 18.0 (SPSS, Inc., Chicago, IL, USA). A P-value of <0.01 was used to indicate statistical significance. Correlations were determined using Pearson's correlation coefficient test.
RESULTS
A total of 336 volunteers (199 women and 137 men) of 13 to 77 years of age were recruited to this study. An intra-individual comparison showed a trend towards greater strength in the right hand, though it was statistically insignificant. All of the mean strength measurements were significantly greater in males than in females (Table 1).
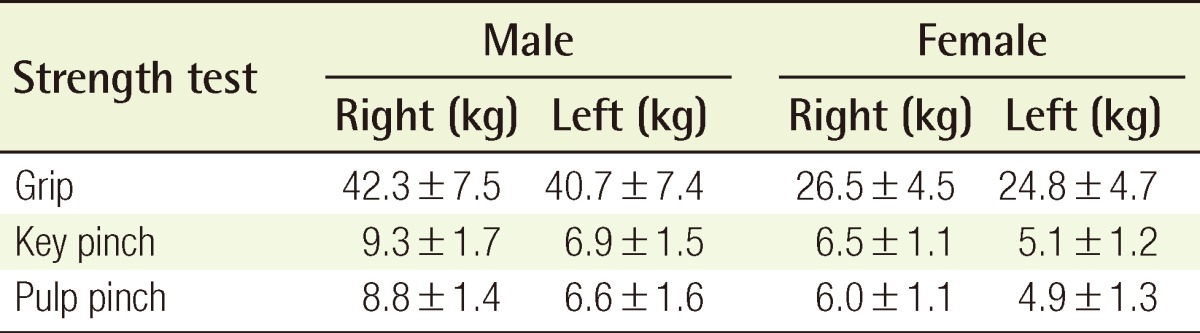
Average hand strength values in the Korean population
Taking the teen group (10 to 19 years old) as baseline, hand strength showed the most drastic increase into young adulthood (20 to 29 years old). This rise in hand strength plateaued among the 30 to 39 year-old subjects and declined gradually back to the baseline strength among the geriatric population. This pattern of hand strength across the age groups is the most noticeable in the measure of gross motor function, which is demonstrated by the grip strength (Table 2). For key and pulp pinch strength, the trend across age groups also appears to follow the same pattern, though the differences appear to be smaller (Tables 3, 4). This is most likely a reflection of the fact that the pinch strength tests assess fine motor functions, which would be expected to have small differences in strength.
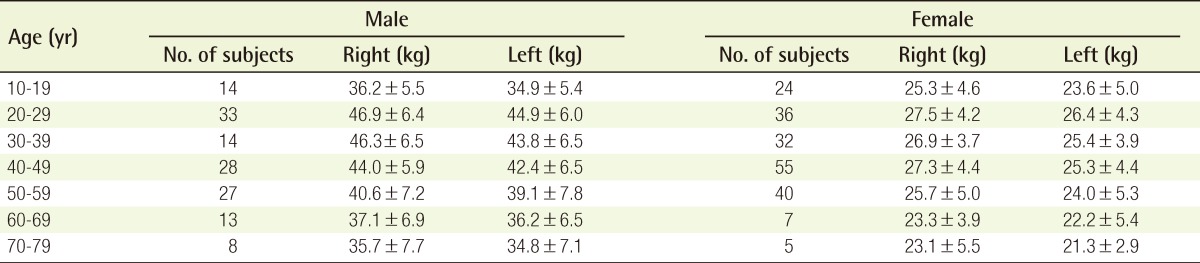
Grip strength by age
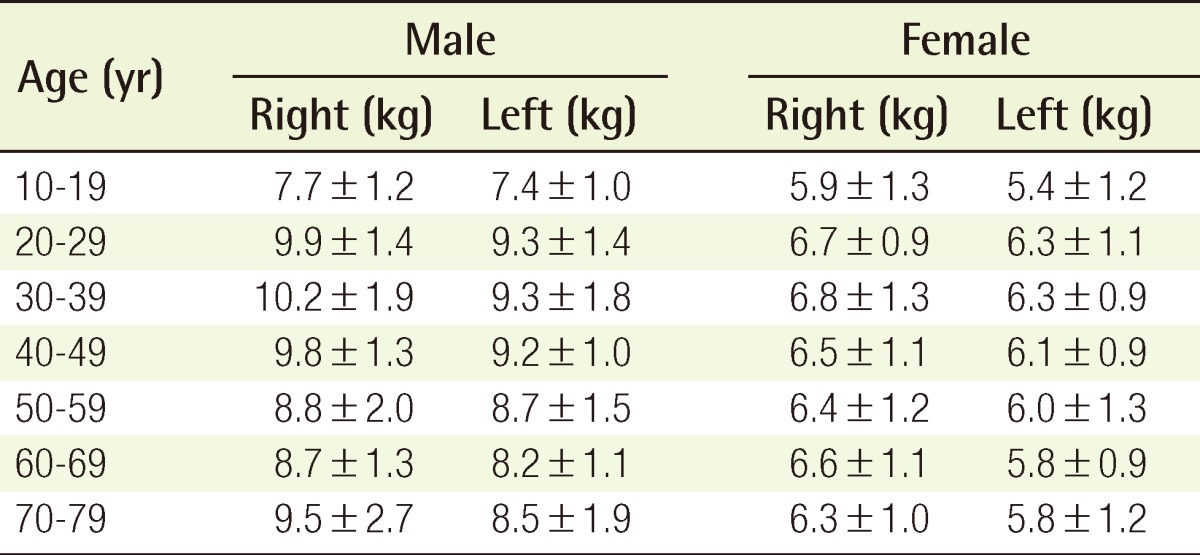
Key pinch strength by age
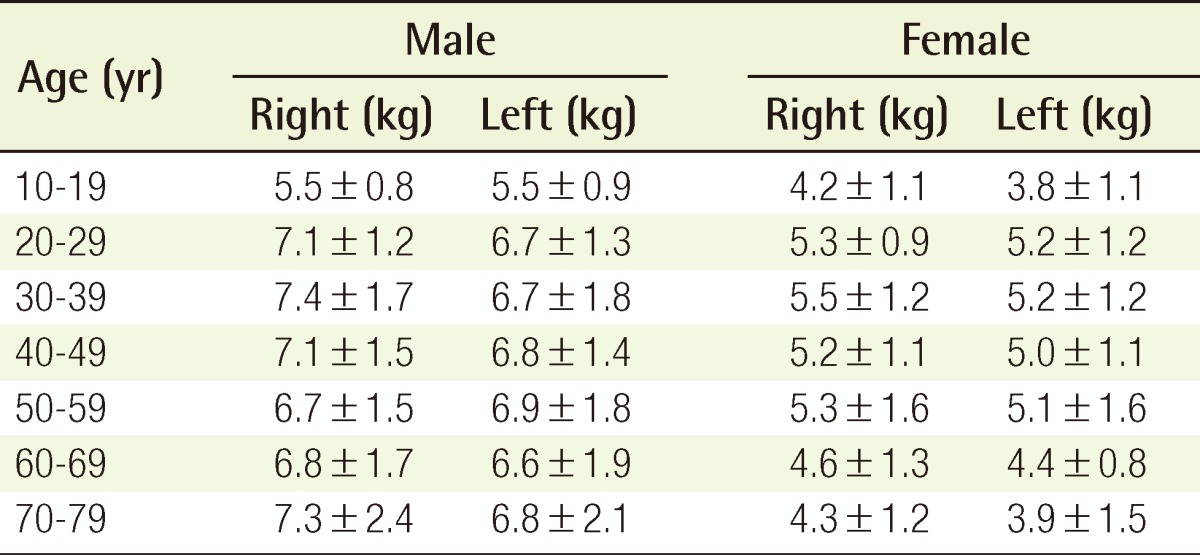
Pulp pinch strength by age
Hand dominance was found to have no significant correlation with measured variables, though there was a trend towards the dominant hand having greater strength (Table 5). As mentioned above, anthropometric data such as total body weight, height, hand width and length, and forearm length and circumference were obtained (Table 6). Among male participants, all metrics but the forearm lengths were found to correlate with grip strength (r=0.4-0.5) but not so with pinch strengths, which are fine-motor skills. Among female participants, no such statistically significant correlations were found.
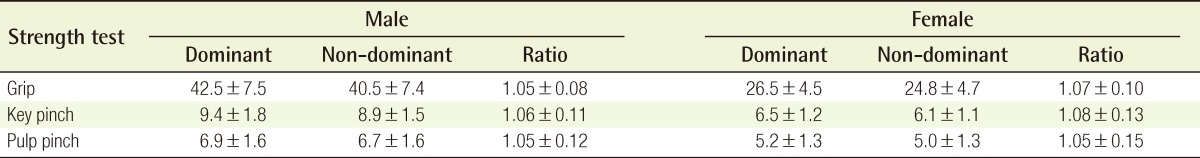
Strength ratio of the dominant to non-dominant hand
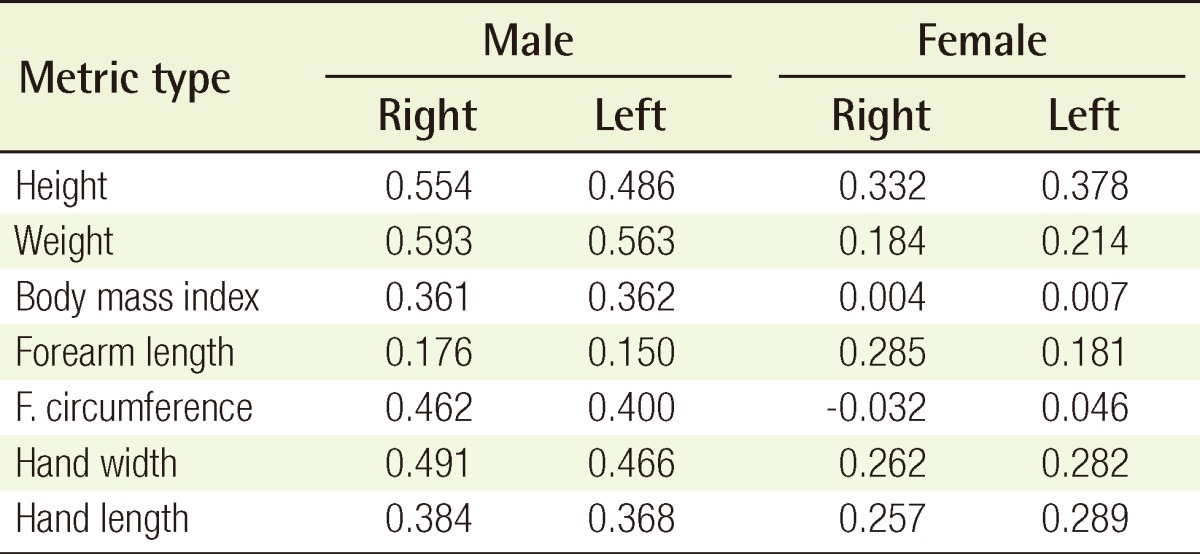
Correlation between anthropometry and hand strength (R-value)
DISCUSSION
The hand is not a fixed, static structure but a dynamic sensorimotor organ with an incredible repertoire of motor functions. The primary aim of reconstruction of an injured hand is to restore as much of these lost functions to the hand, and consequently, much of the hand surgery literature has been dedicated to the recovery of sensory and neuromuscular functions.
Objective assessment of both tactile resolution and passive ranges of motion are made possible by the wide availability of normative data [1]. However, such normative data cannot be generalized for hand strength measurements because of the wide range of demographic and physiologic factors influencing hand strength.
The hand dynamometer and pinch gauges are inexpensive, easy to administer, and are considered to provide repeatable measurements in clinical settings as well as for research purposes [9]. Such strength measurements, however, are only useful in the presence of normative data derived from the population of concern. Without a pre-existing cross-sectional study providing such data, hand strength measurements can only provide a limited picture of clinical progress in postoperative or medical patients.
In 1975, a study by Oh [17] provided normative values of grip strength among the South Korean population. Unfortunately, the data from the study were reported in a publication that no longer exists, and extant copies of the publication are not widely available, even among hand surgeons living in Korea.
Additionally, anecdotal experiences of Korean hand surgeons who are familiar with Oh's publication have suggested that the values reported in the study might be outdated. During the ensuing decades since Oh's report, the population in South Korea has experienced an exponential economic growth with a resultant demographic transition as well as drastic improvements in nutrition and overall health outcome measures [18].
In this present study, grip strengths peaked in the young adult group (20 to 29), and this outcome most obviously reflects the variations of muscular mass, which peaks during this period, in the normal course of human development [19]. This result is consistent with the age-related patterns reported by Oh [17], Schmidt and Toews [20], and Lunde et al. [21].
The mean grip strength values in this study were greater than the values published by Oh [17]. Taking the male group of 20 to 29 years age, a comparison can be made. In our study, the grip strengths were 46.9 kg and 44.9 kg in the right and left hands. These values are higher than the results reported 35 years ago by Oh [17], which were 42.1 kg and 38.6 kg, respectively.
It is worth noting that the 20- to 29-year-old participants in this study had all been born after Oh's study [17]. The epidemiologic significance is that the increased hand strength appears to reflect the dramatic nutritional and public health improvements that the South Korean population has experienced in the past several decades [18].
In any given population, the hand strength ratios appear consistent. Among the male participants in this study, the strength ratio between the dominant and non-dominant hand was 1.05±0.08. This is similar to the ratio reported among Caucasian individuals by Schmidt and Toews [20] (1.03±0.05) and also to the ratio reported earlier in the Korean population (1.02±0.14) [17]. This overall similarity in strength ratios could also be observed among the female populations from this study, from the study by Oh, and from those reported by Lunde et al. [21] (Table 7).
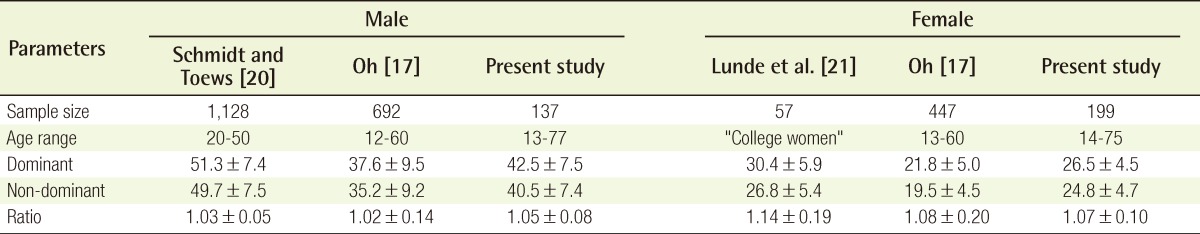
Comparison to previously-published hand strength ratios
Adjusting for sex and age group, however, the absolute normative values from this study are different from those of the Korean population circa 1975 and, also, from those of Caucasian populations [14]. Thus, we believe that our research data represents more valid and up-to-date normative hand strength data for the population of interest.
An argument could be made as to whether this data holds any clinical utility. Of course, objective measurements of hand strength are not routine parts of a primary-care exam, and an individual who presents to a hand clinic most likely would not have had undergone such measurements prior to an injury. Furthermore, certain types of hand injury do not affect strength outcomes-especially those distal injuries that spare mechanical components such as bones and tendons.
When an injury or a disease process does decrease hand strength, however, the consequent result is a decrease in the overall function of the involved hand. Population-specific normative data is useful in the management of such patients who experience declining hand strength. The normative data validates the intra-individual standard of using the non-injured hand as the control-with the understanding that a dominant hand is only marginally stronger than the non-dominant one.
Normative hand strength data holds an even more significant utility in the management of injuries or disease processes that involve both hands. When both hands are affected, neither of them can serve as a control for the other. In such cases, hand strength data provides the most useful standard for monitoring hand strength. At any point in the management of such patients, a significant deviation from the expected range of hand strengths would certainly warrant a clinical investigation for unrecognized pathology and intervention, if necessary.
In summary, this study presents updated normative data on hand strengths in the South Korean population. The characteristics of hand strength across demographic variables and hand-dominance are consistent with previously published studies. Of special note is that absolute hand strength measurements can neither be used across ethnicity nor populations that have experienced rapid economic development. This is evidenced by the change in hand strength among the South Korean population in the past four decades.
The hand dynamometer and pinch gauge used in this study are inexpensive and easy to use. The measurements obtained from these instruments are reliable and objective. Used in conjunction with available normative data, hand strength exams allow progressive assessment of hand function in both post-surgical and medical patients. The authors believe these strength tests to have a valid clinical and epidemiologic utility for the population studied.
Notes
No potential conflict of interest relevant to this article was reported.