Self-Reported Speech Problems in Adolescents and Young Adults with 22q11.2 Deletion Syndrome: A Cross-Sectional Cohort Study
Article information
Abstract
Background
Speech problems are a common clinical feature of the 22q11.2 deletion syndrome. The objectives of this study were to inventory the speech history and current self-reported speech rating of adolescents and young adults, and examine the possible variables influencing the current speech ratings, including cleft palate, surgery, speech and language therapy, intelligence quotient, and age at assessment.
Methods
In this cross-sectional cohort study, 50 adolescents and young adults with the 22q11.2 deletion syndrome (ages, 12-26 years, 67% female) filled out questionnaires. A neuropsychologist administered an age-appropriate intelligence quotient test. The demographics, histories, and intelligence of patients with normal speech (speech rating=1) were compared to those of patients with different speech (speech rating>1).
Results
Of the 50 patients, a minority (26%) had a cleft palate, nearly half (46%) underwent a pharyngoplasty, and all (100%) had speech and language therapy. Poorer speech ratings were correlated with more years of speech and language therapy (Spearman's correlation= 0.418, P=0.004; 95% confidence interval, 0.145-0.632). Only 34% had normal speech ratings. The groups with normal and different speech were not significantly different with respect to the demographic variables; a history of cleft palate, surgery, or speech and language therapy; and the intelligence quotient.
Conclusions
All adolescents and young adults with the 22q11.2 deletion syndrome had undergone speech and language therapy, and nearly half of them underwent pharyngoplasty. Only 34% attained normal speech ratings. Those with poorer speech ratings had speech and language therapy for more years.
INTRODUCTION
Speech problems are one of the most common clinical features of the 22q11.2 deletion syndrome (22q11DS, OMIM #192430/188400). They are distressing for patients and their caregivers, but a generalization has been made that ultimately most patients learn to speak and communicate effectively [1]. Naturally, parents of young, newly diagnosed patients inquire about what to expect with respect to the clinical course and therapy.
The incomplete closure of the velopharyngeal valve, also known as velopharyngeal dysfunction (VPD), manifests as feeding difficulties in infants and speech problems once older. In patients with 22q11DS, VPD may be caused by a cleft palate and different velopharyngeal proportions (platybasia and a wide, deep pharynx), and often includes a neuromuscular component [2,3,4,5]. Speech problems include hypernasal speech, audible nasal emission/turbulence and weak pressure consonants, glottal articulation, and laryngeal phonation [6]. The prevalence among patients with 22q11DS is cited as 27%-92% [1,7,8,9]. This wide range may reflect variable age ranges and patient selection strategies. To date, it is unclear as to how many 22q11DS patients undergo speech and language therapy (SLT) and surgery (palatoplasties and pharyngoplasties) and whether these interventions ameliorate the dysfunction. Surgery is recommended for patients with VPD that is not amendable to SLT.
In the Netherlands, speech-language pathologists who assess patients with 22q11DS in our tertiary referral center advise community-based speech-language therapists on how to tailor the therapy for each patient by using the principles described previously [10]. In patients with low intelligence and/or delayed language, spoken language is combined with sign language. For patients with isolated problems with articulation or resonance, only articulation therapy is advised. However, if patients become frustrated, sign language can be added.
Many studies in which the speech of patients with 22q11DS was assessed only include children up to 11 years of age [3,4,8,11]. One study showed improvement of speech with increasing age, which is perhaps a corollary of development [3], albeit delayed [1,6,12]. In studies including older patients, the speech outcome was not reported separately [4,8,13], preventing conclusions regarding the further course of speech problems. In a study with adults aged 18 years or older, 41% had VPD or hypernasal speech [9]. No mention was made of previous SLT and/or surgery or of the relationship with the outcome. While acquiring data for this study, findings were published on speech and hearing in adults with 22q11DS (age group, 19-38 years) in which 66% were reported to have mild-to-severe VPD [14]. Again, SLT was not inventoried. Surgery was mentioned, but not correlated to the speech.
To date, the extent to which speech improvement can be obtained through SLT and pharyngoplasty in the case of 22q11DS remains unknown. This study aims to fill the gap between young children and adults by focusing on speech in adolescents and young adults with 22q11DS, and exploring the relationship between speech rating and SLT and surgery. In this cross-sectional cohort study, 1) the speech history and current self-reported speech of 50 adolescents and young adults with 22q11DS was inventoried through questionnaires, and 2) possible variables influencing the current speech ratings (including cleft palate, surgery, SLT, full-scale intelligence quotient [FSIQ], and age at assessment) were examined.
METHODS
Research plan
To study this, a cohort of adolescents and young adults with 22q11DS and their caregivers completed questionnaires to inventory the speech history and current speech rating, and a neuropsychologist administered an FSIQ test. The demographics, histories, and intelligence of patients with normal speech (speech rating=1) were compared to those with different speech (speech rating>1).
Patients
To limit the selection bias, all adolescents and young adults with genetically confirmed 22q11DS in the tertiary hospital's database were invited for analysis. Data analysis was performed after the first 50 patients (age group, 12-26 years; mean age, 18 years), and their caregivers attended the outpatient clinic at the department of psychiatry for a concomitant study on genetics and psychopathology. The hospital's institutional review board approved this study, and written informed consent was obtained from all patients. In the case of patients who were minors, written informed consent was also obtained from their guardians.
Speech evaluation
Patients were given questionnaires (Supplemental Table S1) to complete with their caregivers in order to assess their speech by using the rating used by the Dutch Association for Cleft and Craniofacial Anomalies (Table 1) [15]. This scale is used to assess two aspects of the Speech Parameters Group for reporting speech outcomes in individuals with a cleft palate that have been determined to be socially important: speech understandability and acceptability [16]. The score ranges from 1 to 5. Patients with a speech rating of 1 are deemed to have normal speech, a rating greater than 1 indicates that the patient's speech differs from that of the others, and a rating greater than 3 indicates that the patient's speech is difficult to understand.

Perceptual speech rating (Dutch Association for Cleft and Craniofacial Anomalies) [15]
When a speech-language pathologist clinically rates a patient's speech using the Dutch Association for Cleft and Craniofacial Anomalies [15], the five-point overall speech rating is preceded by sub-questions specifying how frequently others (including the caregiver, the patient's teacher/employer, adults who do not know the patient, and the patient's peers) understand the patient's speech, how frequently the patient receives comments on his/her speech, and how frequently the caregiver needs to explain to others what the patient says. Likewise, in our questionnaire, the question on the five-point overall speech rating was preceded by these sub-questions. We also posed an open question inviting the caregiver to add any explanation.
Determinants
Possible determinants of speech were inventoried through the questionnaire, including demographics, cleft palate (overt and submucous), previous palatoplasty or pharyngoplasty, amount of SLT, ear infections, and the use of hearing aids. A neuropsychologist administered the age-appropriate third edition of the Wechsler Intelligence Scale for Children (WISC-III) or the Wechsler Adult Intelligence Scale (WAIS) tests to assess the current FSIQ.
Statistics
Descriptive statistics were calculated for the factors inventoried through the questionnaire. To determine whether factors were related to speech, the cohort was divided into patients with normal speech ratings (speech rating=1) and those with different speech (speech rating>1). The significance of each of the potential determinants was calculated using the variable-appropriate Mann-Whitney U test (for continuous variables) or the chi-squared test (for binomial variables).
Since cleft palates and pharyngoplasties are important factors affecting the speech outcome, we performed sub-analyses by re-dividing the cohort into groups of patients with and without cleft palates and into groups of patients who had pharyngoplasties and those who did not. Their questionnaire answers and FSIQs were compared again by using the Mann-Whitney U test and the chi-squared test, where appropriate.
We recognized that the categorical classification of speech as either normal or different does not justify the dimensional scale of speech quality and therefore, also tested the continuous spectrum of speech ratings against possible determinants (continuous variables: age at assessment, years of SLT, age at pharyngoplasty, and FSIQ) by calculating Spearman's correlations. All statistical analyses were two-tailed and performed with IBM SPSS Statistics software for Windows (ver. 20.0, Armonk, NY, USA), with statistical significance defined as P<0.05. All P-values were nominal, without corrections for multiple testing.
RESULTS
Overall results
Some caregivers did not answer all the questions, and FSIQs were not available for two patients. A minority (26%, n=13/50) reported having a form of cleft palate, which was repaired either in isolation or in combination with a pharyngoplasty (Fig. 1). Nearly half (46%, n=23/50) of the patients had undergone a pharyngoplasty. Of those who had undergone a pharyngoplasty, 26% (n=6/23) had VPD following a previous cleft palate repair. All patients (100%, n=50/50) had SLT; the median duration was 6 years, once weekly, for 30 minutes per session. Most (66%) stopped SLT because the speech was sufficiently understandable, but some (19%) quit due to a lack of progress. Many (69%) had a history of frequent ear infections and received grommets, with some reporting fewer ear infections following the pharyngoplasty. A considerable number (18%) wore at least one hearing aid. Only 34% of the patients (n=17/50) had normal speech ratings. Even the patients who were reported by the caregivers to have normal speech, were not always understood by the caregivers, the patients' teachers/employers, adults who did not know the patients, and the patients' peers. They still received comments about their speech, and the caregivers sometimes needed to explain what they were trying to say (Table 2).
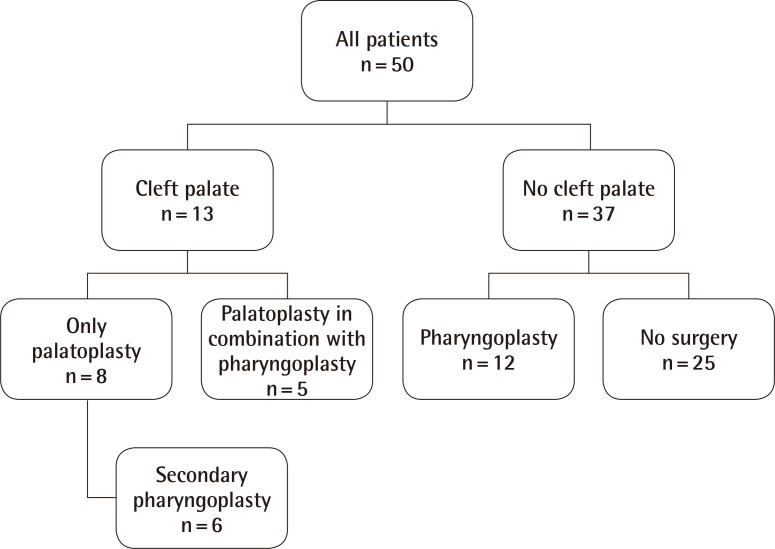
Flowchart of palate status and subsequent surgeries
All patients with a cleft palate (n=13/50) had a palatoplasty; some also had a pharyngoplasty. Nearly half of all patients had a pharyngoplasty (n=23/50). Twenty-five patients did not have a cleft palate and did not have surgery.

Questionnaire answers for all participants, and subgroup analyses for those with normal speech compared to those with different speech
Speech characteristics
Answers to the open question on speech included many specifications that the speech was hypernasal, too quiet, poorly articulated, more like mumbling, monotonous, and poorer when the patient was tired. Some offered reasons for the different speech including "losing air through a small opening somewhere," "the muscles not working," or "the palate being too short." Many pointed out that language choice (the use of only keywords, short phrases, incomplete sentences, and a poor storyline) and shyness further limited understandability. Mentally handicapped peers tended to understand them better; adults who were unfamiliar with their speech had more difficulty understanding them. Even those familiar with the different speech sometimes had difficulty understanding what was being said without knowing the context and often needed to ask the patients to speak more clearly or repeat themselves. One caregiver wrote, "We get used to her speech. Over the phone, the understandability is poor. When speaking to strangers, she does her best to be understood. Apparently, it requires extra effort."
Normal versus different speech
A comparison of the questionnaire answers from the group with normal speech (speech rating=1) to the group with different speech (speech rating>1) showed no significant differences apart from speech understandability (Table 2). There was a trend toward more participants with normal speech being females (P=0.06). Neither a history of a cleft palate nor pharyngoplasty was associated with the speech rating (P=0.34 and P=1.00, respectively). The FSIQs ranged from 45 to 89 in both groups, with a median of around 65 (P=0.43).
Cleft palate surgery and pharyngoplasty
Regrouping the patients for the sub-analysis that compared patients who had cleft palates to those who did not, showed no significant difference in the numbers of patients in each group with normal speech (15% vs. 41%, P=0.17), and the mean speech ratings were the same (2.2 vs. 2.0, P=0.39).
Regrouping the patients for the sub-analysis that compared patients who had pharyngoplasties to those who did not, showed that equal numbers of patients in each group had normal speech (35% vs. 33%, P=1.00), and the mean speech ratings were the same (1.9 vs. 2.1, P=0.60). The only differences between these groups were that the patients who had pharyngoplasties tended to have had more years of SLT (7.5 vs. 5.4, P=0.10) and have higher FSIQs (68 vs. 62, P=0.06).
A comparison of patients who had a pharyngoplasty following a cleft palate repair to those who had a primary pharyngoplasty, showed no difference in the prevalence of normal speech (33% vs. 35%, P=1.00).
Correlations
After testing the continuous spectrum of speech ratings against possible determinants, no correlation was found between speech rating and age at assessment (Spearman's correlation=-0.061, P=0.68; 95% confidence interval [CI], -0.336 to 0.224), speech rating and age at pharyngoplasty (Spearman's correlation 0.013, P=0.95; 95% CI, -0.401 to 0.422), nor speech rating and FSIQ (Spearman's correlation=-0.151, P=0.31, 95% CI, -0.419 to 0.142). However, the speech rating was correlated with the number of years of SLT (Spearman's correlation=0.418, P=0.004; 95% CI, 0.145-0.632), showing that those with poorer speech ratings continued SLT for more years.
DISCUSSION
In the current study, we found that only about one-third of the adolescents and young adults with 22q11DS had normal speech. About half had pharyngoplasties, and all had speech therapy. No determinants were found for a normal speech rating, indicating that a history of cleft palate or surgery, age at surgery, FSIQ, and age at assessment are unlikely to be strong predictors of the speech outcome in patients with 22q11DS. The only difference detected was that those with poorer speech ratings continued SLT for more years. Factors that can account for the fact that we did not find any predictors in this study are as follows: 1) Self-reported speech rating on a five-point scale is not sufficiently sensitive to pick up important but subtle differences in the speech outcome, and 2) given the multi-factorial etiology of speech problems in 22q11DS [3,5], many more patients will likely need to be recruited to find predictors of the speech outcome. A strength of this study is the fact that we recruited patients from the department of psychiatry, independent of anyone involved in speech therapy or surgery. While the overall speech rating remains "different" in patients with 22q11DS as compared to the general population, surgeons and speech-language pathologists should not be disheartened: Improvement can also be considered a "success." In 1960, a surgeon attested that "The effect of even a little improvement on the personalities of these discouraged and misunderstood patients [with cleft-type speech] has been very dramatic." [17].
Questionnaire
Data acquisition was challenging in this group of patients. Some patients spend hours traveling to the tertiary hospital, where they then spend many hours doing different tests and seeing different specialists. To minimize their burden, we did not extend their hospital visit with a formal speech test administered by a speech-language pathologist, but used questionnaires. Performing a survey in this manner allowed us to study a much larger cohort of patients with 22q11DS than would otherwise have been possible. Additionally, ratings as seen through our patients' eyes are truly what matter the most.
Although we attempted to limit the selection bias by collaborating with researchers who invited all adolescents and young adults for a concomitant study on genetics and psychopathology, it is still possible that patients who volunteered to participate in these studies may not be representative for the entire 22q11DS population. Perhaps those with a more severe phenotype were more motivated to participate.
Furthermore, questionnaires have limitations. Our questionnaire was not validated; rather, it resembled a structured interview (Supplemental Table S1). Inherently, there was an element of recall bias where caregivers were asked to remember, for example, whether patients had frequent ear infections and how much SLT they had. We could not confirm assertions via medical files because patients were treated at other centers.
The speech rating measure is subjective: Different speech assessors have different standards. Some parents may be very satisfied with their child's imperfect speech because they are proud of improvements following years of SLT. Others may continue to be disappointed with minor imperfections. A speech-language pathologist's assessment remains the gold standard for evaluating speech [18]. In research settings, scientific credibility is increased when multiple blinded assessors score recorded speech samples [14]. However, given the constrictions in research funding and the study burden for participants, in this study, speech was not assessed by (multiple) speech-language pathologists. Instead, we resorted to assessing speech via the questionnaires. We feel that, while not a gold standard, this layperson's speech assessment does provide an important measure of how patients and their caregivers perceive the quality of speech.
Speech
Our findings confirm previously reported observations in younger patients with 22q11DS: the speech is hypernasal, quiet, poorly articulated, and sometimes difficult to understand even for those who know the patient well [6,11]. While hypernasality is partially amenable via surgery, other aspects remain abnormal in many patients [19,20]. In a study on patients aged 1-54 years, speech problems started early and were a major problem for many patients until the age of 10 years but gradually diminished with increasing age or after pharyngoplasty [12].
We found that all patients had SLT. A lack of specification about the type of therapy that they had hampers the drawing of conclusions on the effect. The median duration was 6 years, once weekly, for 30 minutes per session. This is much longer than reports from another center where, following a pharyngoplasty, patients receive 20-30 minutes of SLT weekly for an average of 8 months (maximum, 25 months) [13]. Others have found that greater speech improvement was attained and maintained over a longer period when SLT was more frequent than once weekly [21]. In the Netherlands, SLT is part of the basic universal healthcare coverage package for all patients with a diagnosis. Children who are enrolled for special education receive intensive SLT early on, which tapers off to once a month once they grow older. The speech-language pathologists at our tertiary referral hospital advise community-based speech-language pathologists to administer blocks of therapy because the learned skills often deteriorate in patients with 22q11DS. Future research could focus on the details of SLT including motor speech disorders, compensatory articulation, language disorders, and the effect of therapy.
The indication for surgery is hypernasal speech, which is resistant to SLT. Nearly half of our patients had pharyngoplasties. Worldwide, among patients with 22q11DS who undergo surgery to correct VPD, only 51% achieve normalized resonance [2]. In this study, we found that as adolescents and young adults, their speech ratings (median rating, 2/5) were not significantly different from those of patients who did not have surgery. This may attest to the efficacy of surgery to improve speech in children with poor preoperative speech ratings (median rating, 4/5). However, the natural course of speech ratings in children with poor speech ratings has not been studied.
It is unclear whether a speech plateau is reached in adolescents and young adults after SLT and surgeries. Our data are surprisingly consistent with a previous, smaller study (n=24) among adults with 22q11DS [14], which reported palatal anomalies in 39% (in our study, 26%), pharyngoplasties in 50% (in our study, 46%), and absent VPD in 33% (in our study, 34% had "normal" speech). The speech-language pathologists who evaluated the speech in that study also noted that the patients' voices were quiet and monotonous. However, in a larger study with adults of the age of 18 years or older, only 41% had VPD or hypernasal speech [9].
Cleft palate
In our study, 26% of the patients had some form of palatal cleft. Prevalence rates reported in other studies vary as a function of patient selection, with the greatest prevalence reported by cleft centers [3] and lower rates in samples not (exclusively) derived in cleft clinics. An overt cleft palate is seen in 11% [1,12,19] and a submucous cleft palate is seen in 2%-16% [1,8], but the latter is very difficult to identify without nasendoscopy and therefore, significantly underestimated [22].
Ear infections and hearing
In our study, 69% of the patients reported having frequent ear infections, 79% had grommets, and 18% wore a hearing aid. This prevalence of ear infections is higher than the reported 2%-50% [1,8,23] in larger studies but may be related to the age range of the patients sampled. In those large studies, the prevalence of conductive hearing loss was 31%-84% and that of sensorineural hearing loss was only 2%-11% [1,23]. In the small study among adults with 22q11DS, 41% had a hearing impairment, half of which were conductive, one-third sensorineural, and the others mixed [14]. Hearing loss is thought to be secondary to palatal abnormalities [8]. While hearing impairment negatively affects speech intelligibility, it was not found to be related to velopharyngeal function [14]. In our study, 27% reported less frequent ear infections following pharyngoplasty.
Intelligence quotient
We measured a median FSIQ of 65 (range, 45-89), which is near the adult mean of 70 [1,24]. Patients with normal speech ratings did not have higher FSIQs than those with different speech. If FSIQ affects the ability to apply techniques learned in SLT [25], patients with lower FSIQs would be expected to have poorer speech ratings. The lack of association between the eventual speech rating and FSIQ (Spearman's correlation=-0.151, P=0.31; 95% CI, -0.419 to 0.142) may provide evidence that the advice to tailor SLT to the FSIQ is effective. However, since the application of this advice is dependent on implementation by the many community-based speech-language pathologists, it is more likely that the speech rating is not associated with FSIQ.
In conclusion, we specifically studied adolescents and young adults with 22q11DS to give clinicians concrete numbers to quote to caregivers of young patients who seek information about the expected course of speech problems. We confirmed earlier observations that speech problems are highly prevalent in patients with 22q11DS: All adolescents and young adults with 22q11DS had SLT, and nearly half of them had pharyngoplasties. Only 34% attained normal self-reported speech ratings. No determinants were found to predict the speech rating, including a history of cleft palate or surgery, age at surgery, FSIQ, and age at assessment. Those with poorer speech ratings continued SLT for more years. While speech does not normalize in a majority of patients, it is generally understandable and acceptable, allowing most patients to speak effectively [1].
Notes
This article was presented as (Oral presentations) at the Nederlandse Vereniging voor Plastische Chirurgie Wetenschappelijke Vergadering (Nijmegen, The Netherlands, October 2013), the American Cleft Palate Association 71st Annual Meeting (Indianapolis, USA, March 2014), and The 9th International 22q11.2 Deletion Syndrome Meeting (Mallorca, Spain, June 2014).
The authors would like to thank Sanne Koops and Marije Rozendal for recruiting patients at the Department of Psychiatry, and Hester de Wilde for providing insight into the speech and language therapy regimen.
No potential conflict of interest relevant to this article was reported.
References
Supplementary Material
Supplemental Table S1
Speech Questionnaire
Supplemental data can be found at: http://e-aps.org/src/sm/aps-41-472-s001.pdf