Photogrammetric Analysis of Attractiveness in Indian Faces
Article information
Abstract
Background
The objective of this study was to assess the attractive facial features of the Indian population. We tried to evaluate subjective ratings of facial attractiveness and identify which facial aesthetic subunits were important for facial attractiveness.
Methods
A cross-sectional study was conducted of 150 samples (referred to as candidates). Frontal photographs were analyzed. An orthodontist, a prosthodontist, an oral surgeon, a dentist, an artist, a photographer and two laymen (estimators) subjectively evaluated candidates' faces using visual analog scale (VAS) scores. As an objective method for facial analysis, we used balanced angular proportional analysis (BAPA). Using SAS 10.1 (SAS Institute Inc.), the Turkey's studentized range test and Pearson correlation analysis were performed to detect between-group differences in VAS scores (Experiment 1), to identify correlations between VAS scores and BAPA scores (Experiment 2), and to analyze the characteristic features of facial attractiveness and gender differences (Experiment 3); the significance level was set at P=0.05.
Results
Experiment 1 revealed some differences in VAS scores according to professional characteristics. In Experiment 2, BAPA scores were found to behave similarly to subjective ratings of facial beauty, but showed a relatively weak correlation coefficient with the VAS scores. Experiment 3 found that the decisive factors for facial attractiveness were different for men and women. Composite images of attractive Indian male and female faces were constructed.
Conclusions
Our photogrammetric study, statistical analysis, and average composite faces of an Indian population provide valuable information about subjective perceptions of facial beauty and attractive facial structures in the Indian population.
INTRODUCTION
The available literature on the photogrammetric characteristics of attractive, unattractive, and average faces in different races is limited. Previously, investigators have used a variety of methods to assess facial attractiveness. For example, symmetricity ratings, the averageness hypothesis, and the golden (phi) ratio or proportions have been considered to be viable methods of analyzing facial beauty [123]. However, these methods have failed to provide consistent and dependable results for the analysis of facial beauty. For example, Bashour [1] tested the phi mask, created by Dr. Stephen Marquardt, as a method of measuring facial attractiveness in an objective manner. However, Holland [4] suggested that Marquardt's mask failed to describe an ideal face shape, as its proportions were inconsistent with the preferences of the population as a whole. Evidently, insufficient photogrammetric data exist to support the identification of an objective method for assessing differences in the soft tissue configuration and facial attractiveness of humans.
This photogrammetric study used an experimental method of photogrammetry known as balanced angular and proportional analysis (BAPA), and was designed with the objective of assessing characteristic facial features in an Indian population, evaluating the presence of statistically significant differences in subjective ratings of facial attractiveness between experts and laymen, identifying facial aesthetic subunits relatively important for facial attractiveness, developing an objective method for facial analysis, and improving the available data regarding attractive photogrammetric norms in the Indian population.
METHODS
Preparation and standardization of facial photographs
This cross-sectional study was conducted on 150 samples (referred to as candidates) from an Indian population composed of an equal number of males and females. Approval from the ethical committee of Kothiwal Dental College & Research Centre and individual consent were obtained in India. The selected individuals ranged in age from 18 to 24 years. Candidates were selected and photogrammetric standardization of the images was performed according to the method described by Duggal [5]. In order to facilitate the accurate analysis of facial attractiveness, the photographs of the candidates were cropped to display only the face.
Assessment of the subjective rating of facial appearance using visual analog scales (VAS)
A total of 150 candidates and eight human evaluators (referred to as estimators) with various types of employment voluntarily participated in the study. The estimators were classified according to profession: an orthodontist, a prosthodontist, an oral surgeon, a dentist, an artist, a photographer, and two laymen (one man and one woman). Facial photographs of each of the 150 candidates were displayed on a computer. Each estimator evaluated the facial attractiveness of each candidate by reporting a subjective opinion on a scale from 0 to 10. All VAS scores were collected on a data sheet. As human perceptions of facial beauty were expected to vary depending on profession, the estimators were subcategorized into three-groups: all estimators, clinical practitioners (the orthodontist, the prosthodontist, the oral surgeon, and the dentist), and non-specialists (the photographer, the artist, and the two laymen).
Photogrammetric facial analysis using BAPA
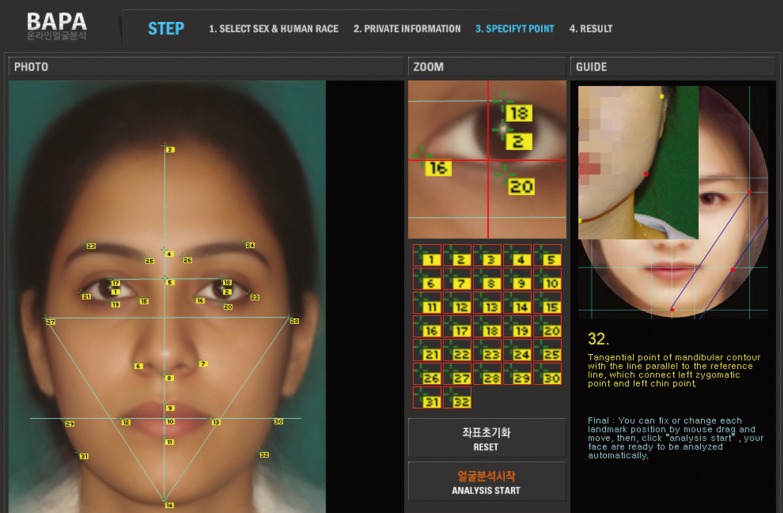
In order to analyze the faces objectively, an experimental photogrammetric facial analysis program (available freely at http://bapa.co.kr) known as BAPA was utilized [4]. Although the BAPA algorithm was not derived from norms or scales of attractive Indian faces but from average anthropometric data of the Indian population, we adopted this program for photogrammetric facial analysis because it is simple to use and provides objective and automated statistical reports about individual facial characteristics [6]. In BAPA, 28 frontal soft tissue landmarks, 10 defined proportions, and four angles for each photograph were arithmetically measured and analyzed (Table 1). Any user can define each landmark by clicking and dragging each point with the aid of guidelines (Fig. 1). Although the program can analyze both the frontal and lateral face separately, we only measured the frontal face in this study. After BAPA analyzed a candidate's facial aesthetic subunits and reported its statistical significance, harmony index, and comparative overall scores of facial attractiveness (BAPA scores) of each aesthetic subunit as a percentage (Fig. 2), we recorded the BAPA data as the recommended aesthetic mean angles (RAMA) and the recommended aesthetic mean proportions (RAMP) [6]. After processing 150 samples using BAPA, we collected the harmony indices of each facial subunit (H-indices) and the overall BAPA scores of each face and recorded the results. BAPA scores actually measure the degree of similarity of an individual facial configuration to an average Indian face. The photogrammetric facial analysis resulted in the acquisition of 14 harmony indices (10 reflecting proportional measurements and four reflecting angular measurements). A double-blind determination test was carried out to analyze landmark errors during the process of BAPA analysis among users, and the differences were found to be non-significant.
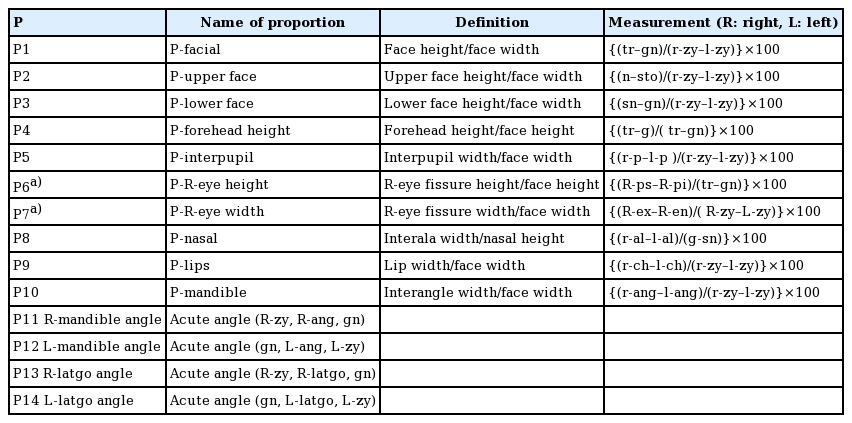
Landmarks and measurements in the balanced angular proportional analysis (BAPA) of frontal facial images
Photogrammetric measurement of facial attractiveness
We connected to the balanced angular proportional analysis (BAPA) website (http://bapa.co.kr). We defined each landmark by clicking and dragging each point with the mouse with the aid of the guidelines.
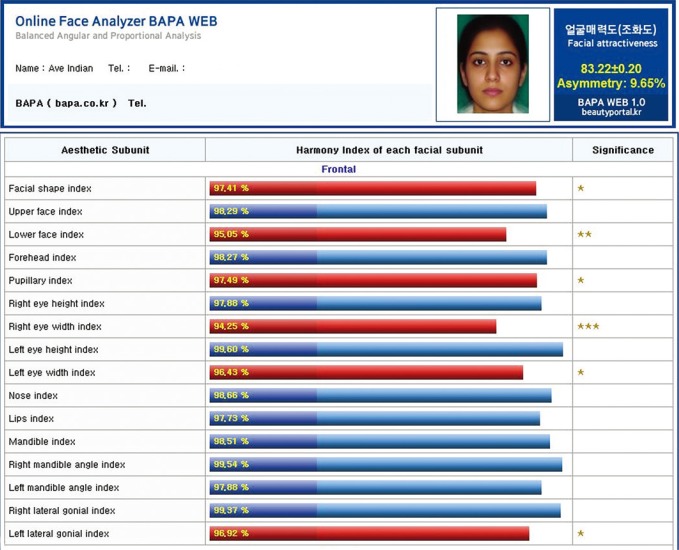
BAPA report of facial attractiveness
We uploaded a female composite face to the balanced angular proportional analysis (BAPA) website and performed a photogrammetric analysis. BAPA scores of facial attractiveness were expressed with '±error' ('error' means deviation due to an incorrect landmark placed by users). Harmony indices of each aesthetic subunit and statistical significance were shown with the number of asterisks. The BAPA score was 83.22±0.20 for this female face. For the below female composite face, the facial shape index (within one standard deviation [SD]), lower facial index (within two SDs), pupillary index (within one SDs), right eye width index (within three SDs), left eye width index (within one SD), and left lateral gonial index (within one SD) were out of the ranges associated with reference Indian values.
Statistical analysis
Experiment 1. Differences in facial attractiveness judgments according to the professions of the estimators
As previously discussed, the estimators contained an orthodontist, a prosthodontist, an oral surgeon, and a dentist, and it was plausible that the VAS scores reported by these medical and dental specialists would be different from those reported by members of the general public, such as the artist, the photographer, and the laymen. Thus, statistical analysis was performed to assess differences in judgment regarding facial attractiveness according professional status. In particular, we attempted to identify differences in the VAS scores between clinical practitioners and members of the general public.
Experiment 2. Assessment of the overall correlation of VAS scores with BAPA scores
Since the VAS scores were determined by people and the BAPA results were determined by a computer program, we considered it likely that the comparison of VAS scores with BAPA results would help identify which facial aesthetic subunits were relatively important for facial attractiveness. However, since the BAPA scores were not based on an attractiveness scale, but on an average scale for the Indian population, our objective was not to calculate the accuracy of the attractiveness scale of the BAPA program, but to verify the theory of averageness, which states that attractive faces are the average of the faces of ordinary people [2]. We examined the overall correlation between VAS scores and BAPA scores, and predicted that comparing VAS scores and BAPA scores would verify the theory of averageness as a dependable method of assessing facial attractiveness.
Experiment 3. Assessment of differences in facial configuration between unattractive and attractive faces
In this experiment, we attempted to determine why people perceive certain individuals as relatively attractive, based on the hypothesis that attractive faces differ from unattractive faces in facial configuration and structure. Therefore, we divided the faces into two groups. Group 1 (unattractive faces) comprised faces possessing lower VAS scores than the median value (5.62) of VAS scores among all candidates rated by all estimators. Group 2 (attractive faces) comprised faces possessing VAS scores higher than or equal to the median value of VAS scores among all candidates. The VAS scores, harmony indices, and BAPA scores of each face were collected and analyzed. Statistical analysis was performed on the VAS scores and BAPA results using SAS 10.1 (SAS Institute Inc., Cary, NC, USA). Between-group mean value differences were calculated using the t-test with the significance level set at a P-value of 0.05. Analysis of variance (ANOVA), Tukey's studentized range test, and Pearson correlation analysis were performed for the statistical analysis of differences and correlations between the VAS scores and the BAPA scores. Since the BAPA scores were initially recorded on a scale of 100 points, we normalized the attractiveness scale to be scored out of 10 points.
RESULTS
Fig. 3 is a summary of the VAS scores from different estimators for the 150 candidates. As subjective human opinions regarding facial attractiveness are diverse, we investigated the presence of between-group differences among estimators in the subjective visual ratings of facial attractiveness of each of the candidates. We considered the VAS scores of an orthodontist, a prosthodontist, an oral surgeon, a dentist, a photographer, an artist, and two laymen as independent variables. ANOVA revealed that the VAS scores of the artist (6.29±1.41; range, 3.0–9.0) and the orthodontist (6.11±1.58; range, 1.0–9.0) had significantly different mean values and were relatively higher than those of other estimators (F=10.54, P<0.001). The mean values of the VAS scores from other estimators were very similar: the prosthodontist, 5.44 (range, 3.0–9.0; standard deviation SD, 1.31), the oral surgeon, 5.32 (range, 2.0–9.0; SD, 1.49), the dentist, 5.34 (range, 2.0–9.0; SD, 1.71), the photographer, 5.39 (range, 2.0–9.0; SD, 1.82), and an average of two laymen, 5.44 (range, 1.0–9.0; SD, 2.0). We found that the artist and orthodontist gave somewhat higher VAS scores to candidates, which is not surprising, as individuals possess varying opinions regarding other people's facial attractiveness.
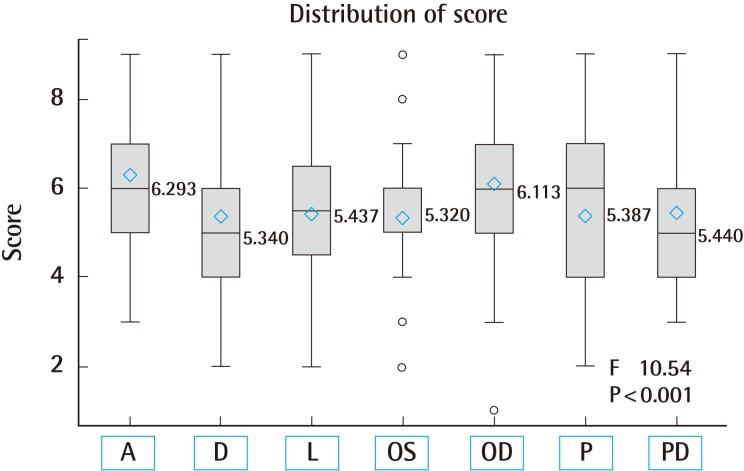
Summary of visual analog scores (VAS) from different estimators for 150 candidates
Tukey's mean difference test revealed that the mean VAS scores of the artist (6.29±1.41; range, 3.0–9.0) and the orthodontist (6.11±1.58; range, 1.0–9.0) were significantly different in comparison to those from the other estimators: the prosthodontist, 5.44±1.31 (range, 3.0–9.0); the oral surgeon, 5.32±1.49 (range, 2.0–9.0); the dentist, 5.34±1.71 (range, 2.0–9.0); the photographer, 5.39±1.82 (range, 2.0–9.0); and the average of two laymen, 5.44±2.0 (range, 1.0–9.0). We also observed that the VAS scores from the orthodontist and the artist were relatively high. In addition, we classified the estimators as clinical practitioners and members of the general public. The former group included the orthodontist, the prosthodontist, oral surgeon, and dentist, and the latter group included the artist, photographer, and two laymen. The VAS scores from the members of the general public (5.71±1.33) were significantly higher than those of the clinical practitioners (5.55±1.06), P=0.006. A, artist; D, dentist; L, average value from two laymen; OS, oral surgeon; OD, orthodontist; P, photographer; PD, prosthodontist.
Experiment 1. Assessment of differences in facial attractiveness judgments according to the professions of the estimators
We assessed differences in VAS scores according to the professions of the estimators. Since the orthodontist, the prosthodontist, the oral surgeon, and the dentist had professions closely related to facial aesthetics, we considered it possible that their VAS scores would possibly be somewhat different from those of an artist, a photographer, and two laymen. Accordingly, we classified the former group as clinical practitioners and the latter group as members of the general public. The VAS scores were individually merged for every candidate. Tukey's studentized range test indicated that the VAS scores from the general public (5.71±0.33) were significantly higher than those reported by the clinical practitioners (5.55±1.06, P=0.006) However, no gender difference was found in the VAS scores of candidates between the clinical practitioners (P<0.517) and the members of the general public (P<0.096). To summarize, differences in VAS scores or subjective perception of facial beauty may reflect employment characteristics. Namely, non-specialists presented somewhat higher VAS scores than dental or medical specialists, but no gender differences were found in the VAS scores of candidates according to different groups of estimators.
Experiment 2. Assessment of the overall correlation of VAS scores with BAPA scores
We performed statistical analysis to identify whether subjective human opinions regarding facial attractiveness were similar to computerized methods of facial analysis. The average BAPA score for all candidates was 0.54±0.18, with a relatively small standard deviation. The VAS scores of all estimators were individually merged, producing average VAS scores for every candidate. Tukey's studentized range test revealed no significant differences between the BAPA scores (0.54±0.18, 95% confidence interval [CI]=0.51–0.57) and VAS scores (0.51±0.18, 95% CI=0.48–0.55) from all estimators (P=0.8700), implying that the overall VAS scores and BAPA scores had a similar mean value. BAPA attractiveness ratings behaved similarly to human subjective feelings regarding facial beauty. Additionally, Pearson's correlation analysis between all VAS scores and BAPA scores supported the hypothesis that people possessing higher VAS scores from estimators would tend to have higher BAPA scores. However, as we had expected, statistically significant results were present, but with a very weak correlation coefficient (R=0.1846; P=0.0237; 95% Cl: 0.17–0.51) To summarize, BAPA attractiveness ratings displayed similar behavior to human subjective feelings about facial beauty, but demonstrated a relatively weak correlation coefficient with the VAS scores assigned by humans.
Experiment 3. Assessment of differences in facial configuration between unattractive and attractive faces
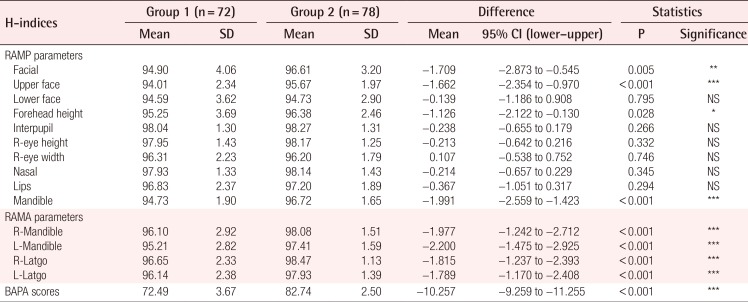
As previously described, we divided faces into two groups. Group 1 (unattractive faces) comprised the faces possessing lower VAS scores than the median value (5.62) of VAS scores among all candidates rated by all estimators. Group 2 (attractive faces) included the faces with VAS scores higher or equal to the median value of all candidates. We assessed the differences in harmony indices between Group 1 and Group 2. Table 2 summarizes these results in all candidates of both genders. There were 72 unattractive faces and 78 attractive faces.
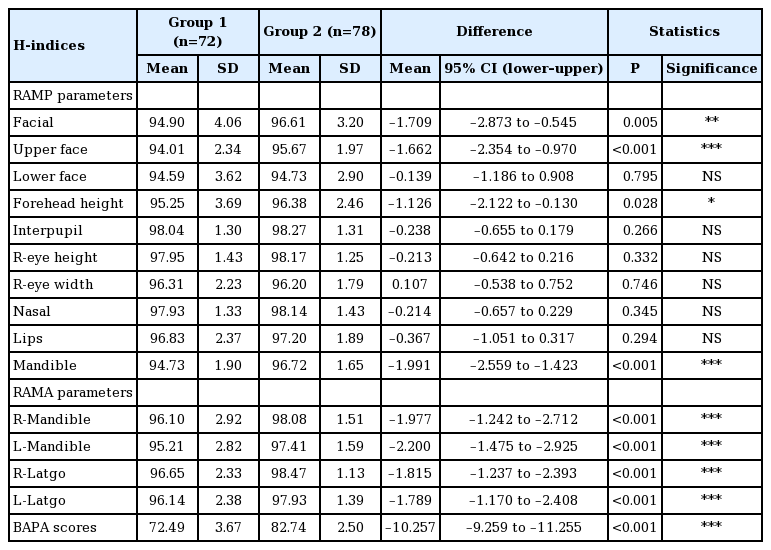
Comparison of the harmony indices (H-indices) and balanced angular proportional analysis (BAPA) scores between Group 1 (unattractive) and Group 2 (attractive) (n=150) (all candidates)
Comparing Group 1 with Group 2 demonstrated the upper face index and the mandible index to be highly significant, at P<0.001. Among the RAMP values from the BAPA analysis, the facial index was statistically significant at P=0.01 and the forehead height index as statistically significant at P=0.05. In contrast, no significant differences were found between the groups in terms of the lower face index, interpupillary index, eye height index, eye width index, nasal index, and the lip index. The facial index, upper face index, and mandible index were all higher in Group 2 than in Group 1 for all candidates. Among the RAMP values, the right mandible angle index, left mandible index, right lateral gonial angle index, and left lateral gonial angle index were significantly higher in Group 2 (P<0.001). Table 2 shows that the BAPA attractiveness scores of Group 2 were significantly higher than Group 1 (P<0.001). To summarize, statistical analysis revealed that the overall shape of the face, the upper facial shape, and the mandibular shape of attractive Indian faces were different from those of unattractive Indian faces, without significant gender differences.
Assessment of decisive aesthetic subunits in the facial attractiveness of female and male faces
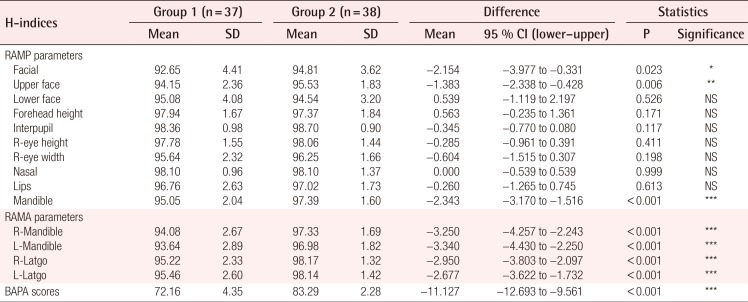
In order to investigate the facial features that would potentially be relevant for distinguishing attractive Indian male and female faces, we divided all data according to gender. Table 3 shows statistical comparisons of attractive Indian females and unattractive Indian females. The facial index was found to be statistically significant, at P=0.05. For female faces, the facial index as well as the indices reflecting the upper face, mandible, left and right mandible angle, and left and right lateral gonial angle were significantly higher in Group 2 than in Group 1. The BAPA scores were also higher in attractive females to a highly significant extent (P<0.001). Table 4 shows differences in attractive Indian male faces in comparison to unattractive faces. The facial index was statistically highly significant at P<0.01. For male faces, the upper face index, forehead height index, and mandible index were highly significant at P<0.001. Among the RAMA values, the left and right mandible index and the left and right lateral gonial angle index were found to be statistically significant. Additionally, the BAPA scores were also statistically highly significant at P<0.001 when Groups 1 and 2 were compared.
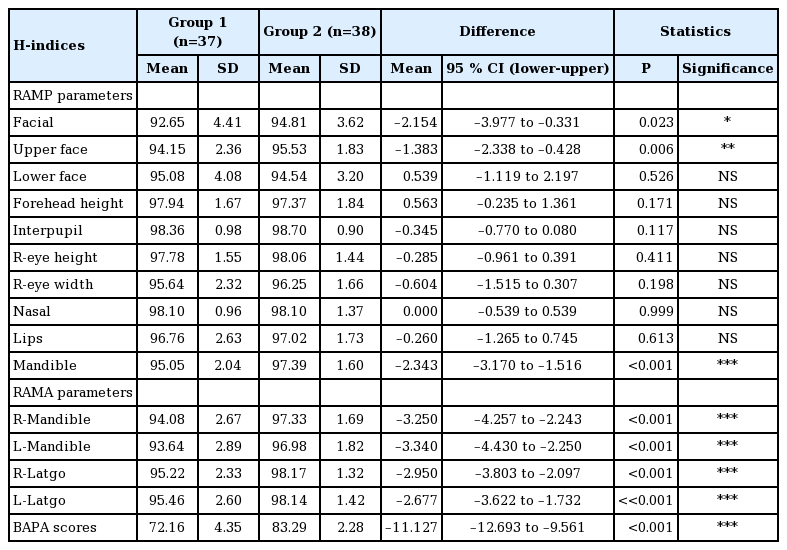
Comparison of the H-indices and BAPA scores between Group 1 (unattractive) and Group 2 (attractive) (female candidates) (n=75)

Comparison of the H-indices and BAPA scores between Group 1 (unattractive) and Group 2 (attractive) (male candidates) (n=75)
We investigated the differences between unattractive and attractive faces among candidates and found that the overall face shape, upper face shape, and overall mandible shape were relatively important factors in ratings of the facial attractiveness of the Indian population. However, some gender differences in facial attractiveness were present. Based on the level of statistical significance of these differences, the overall facial shape and upper facial shape were especially important factors in determining facial attractiveness in Indian males. However, mandibular contour and shape were the decisive factors in determining facial attractiveness in Indian females.
The creation of average attractive composite faces
We created prototype male and female composite faces from the photographs of candidates who received high VAS scores as examples of attractive Indian faces. We used the average morphing method from previously published reports [78]. The composite faces were made from the top 20 attractive male faces and top 20 attractive female faces, which possessed the highest average VAS scores from all estimators (Figs. 4, 5). These composite faces may help improve the available data regarding attractive facial configurations in the Indian population.
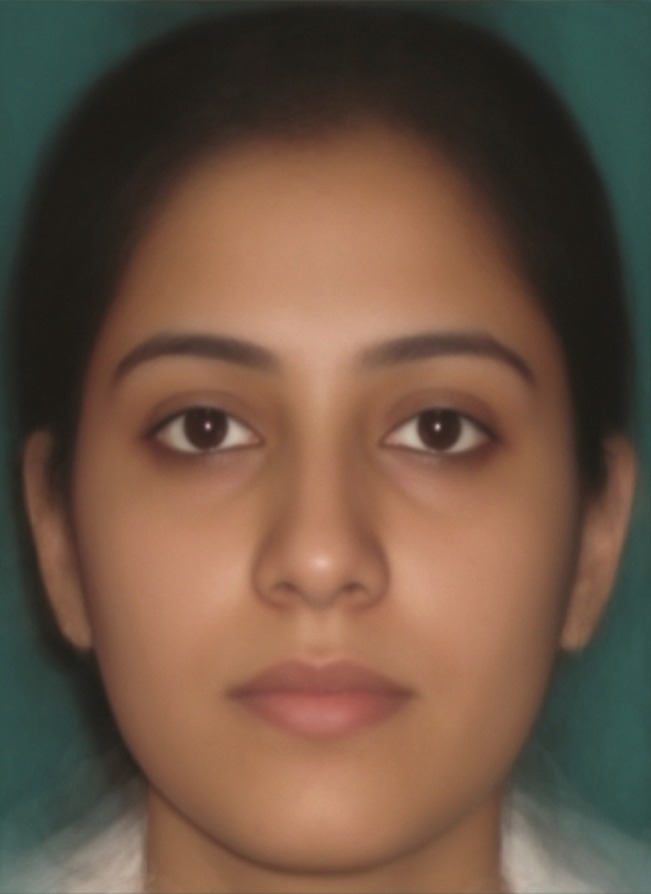
An example of attractive Indian female
This composite face was generated by the morphing method using the images of the 20 most attractive Indian female candidates.
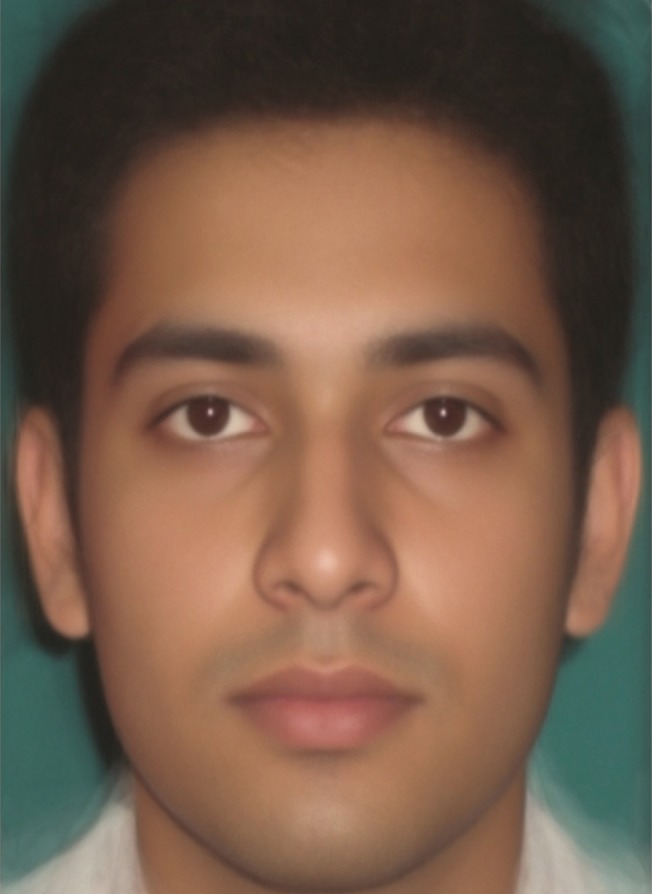
An example of attractive Indian male
This composite face was generated by the morphing method using the images of the 20 most attractive Indian male candidates.
DISCUSSION
Beauty remains one of the most debated concepts in Western literature. Margaret Wolfe Hungerford stated that "beauty is in the eye of the beholder," while Shakespeare noted that beauty is "bought by judgment of the eye" in Love's Labour's Lost [9]. Immanuel Kant remarked that "the beautiful is that which pleases universally without a concept" in an early treatise, entitled Critique of Judgement [10]. Perhaps beauty is a perceivable concept that is void of explanation. This debate will undoubtedly continue.
Although the assessment of facial beauty is immersed in subjectivity, relying on artistic sensibilities, it is generally regarded that perceptions of facial beauty are multifactorial, with genetic, environmental, and cultural foundations [1112]. Many studies have evaluated the aesthetic concepts of the general public, reporting important differences among racial or ethnic groups in the perception of beauty [131415]. Although some cephalometric studies have been published about the inhabitants of India [1617], the soft tissue configuration and gender differences in average and/or attractive Indian faces have not been adequately analyzed. It is well known that anthropometric or photogrammetric methods are preferable to cephalometric methods in determining ideal facial dimensions [18]. We assessed the photogrammetric characteristics of attractive faces in an Indian population and the differences between experts and laymen in the perception of beauty using a photogrammetric method. Knight and Keith [19] also suggested that a series of ranked photographs produced by non-clinicians should be used as the standard to reflect a layman's opinion of facial beauty. The subjective opinions of the general public are very important for the aesthetics of plastic surgery.
In terms of an objective method to assess facial attractiveness, reports have claimed that the 'divine proportion,' phi ratio, or golden proportion may be used in surgical or orthodontic treatment planning [1]. However, it has been found that few conventional ideal ratios and angles possess a significant relationship with facial aesthetics in adolescents [20], and neoclassical canons have been proven invalid for the majority of the population [13]. Rhee developed a photogrammetric facial analysis program known as BAPA, which considers racial, ethnic, and gender differences, regardless of generation and the times, and measures the facial balance and harmony of a given face. The reliability of BAPA has been previously examined and verified, especially in Caucasians and Koreans [67]. Rhee previously attempted to use Pearson's correlation test to confirm the reliability, predictability, and sensitivity of BAPA for Korean faces. He compared a doctor's subjective facial attractiveness rating with attractiveness scales from BAPA. A double-blinded test was performed. Two board-certified plastic surgeons and five residents working in a plastic and reconstructive surgery department subjectively rated 63 female frontal faces for facial attractiveness. BAPA independently measured facial attractiveness. Pearson's correlation coefficient between the attractiveness scores of the BAPA program and subjective facial attractiveness ratings from seven doctors was 0.793 (P<0.001; 95% CI=0.65–0.87; P=0.01). This result has been posted at http://blog.naver.com/artprs/110179850681. We applied this photogrammetric method for facial analysis. Using this computerized photogrammetry method that is available online and a survey of subjective ratings regarding the facial attractiveness of 150 Indian people, this study aimed to assess the attractive facial characteristics of an Indian population, to identify the presence of statistically significant differences in the VAS scores regarding facial attractiveness between experts and laymen, to identify facial aesthetic subunits relatively important for facial attractiveness, and to obtain data regarding the attractive photogrammetric norms of an Indian population, with the goal of improving BAPA reference data for different races.
In Experiment 1, we observed that the VAS scores provided by the orthodontist and the artist were similar and higher than the scores reported by other estimators. This may have been due to individual propensities. Some researchers may consider data from an orthodontist and an artist to be unrepresentative by definition, while others may argue that the inclusion of such data in the assessment of subjective feelings regarding facial appearance is appropriate since human perceptions of facial beauty are expected to be diverse. Since the diversity of perceptions of beauty is generally accepted, we considered it rational to include the VAS scores of an artist and an orthodontist. Experiment 1 confirmed that ordinary people gave somewhat higher VAS scores to candidates than dental or medical specialists, corroborating our expectations. However, no gender differences were found in the VAS scores of candidates according to different groups of estimators. This means that the estimators did not demonstrate gender-related prejudices in facial appearance and gave an impartial opinion to the candidates in general.
As we previously noted, it was not our objective to evaluate the accuracy of the BAPA program. We acknowledge that BAPA scores reflect an analysis of facial attractiveness based on average Indian faces for reference values, not based on a comparison with especially attractive Indian faces. For this reason, we did not initially expect this experiment to find a high correlation coefficient of BAPA scores with VAS scores. However, since the theory of averageness [2]—the belief that "averageness is a standard criteria [sic] and important method for assessing facial beauty"—has been pervasively influential, we expected that Experiment 2 in this study would help confirm the theory of averageness. Experiment 2 found no significant difference between BAPA scores (0.54±0.18; 95% CI=0.51–0.57) and VAS scores (0.51±0.18; 95% CI=0.48–0.55) from all estimators (P=0.8700), implying that the overall mean VAS scores and BAPA scores were similar, which means that the BAPA attractiveness ratings behaved similarly to human subjective ratings regarding facial beauty. Although a statistically significant correlation was found between the VAS scores of all estimators and the BAPA scores, the Pearson's correlation coefficient was weak (R=0.1846; P=0.0237). We argue that this weak correlation originated from the fact that BAPA used average Indian facial data for reference values of photogrammetric facial analysis and the fact that this study included a small number of estimators. Nevertheless, our statistical findings indicate that BAPA scores are somewhat reflective of people's subjective feelings about facial attractiveness. Additionally, in a careful inspection of BAPA scores, we were able to identify a relatively small range and standard deviation in the BAPA scores compared to the VAS scores (the average BAPA score was 7.78±0.62; range, 6.0–9.3), indicating that the BAPA program, in this study of an Indian population, considered most candidates' faces to be similar in the degree of facial attractiveness, with many subjects possessing plain, ordinary, or featureless faces. This finding may provide an adequate explanation of why a weak correlation was found between BAPA scores and VAS scores. In summary, Experiment 2 allows us to conclude that although averageness theory can be applied to facial beauty analysis and can be somewhat reflective of the visual assessment of our estimators' subjective opinions of facial appearance, it may possess a very weak correlation with the subjective opinions of humans. Accordingly, we can conclude that Experiment 2 proved the theory of averageness in beauty assessment to be partially correct, but that it possesses limitations and cannot provide an accurate and consistent analysis of facial attractiveness.
In Experiment 3, we found that overall facial shape and upper facial shape were relatively important factors in determining whether Indian male faces were considered attractive. In contrast, the mandibular contour and shape were the decisive factors in determining whether an Indian female face was considered attractive. We investigated differences in unattractive and attractive faces among candidates and found that the overall facial shape, the upper facial shape, and the overall shape of the mandible were relatively important factors in rating facial attractiveness in the Indian population. We also found some gender differences regarding facial attractiveness. Based on the level of statistical significance of the differences, the overall facial shape and upper facial shape were especially important factors in determining whether ordinary male faces were considered attractive. Interestingly, the forehead shape was not an important factor in determining the degree of attractiveness in females, while it was a relatively important facial aesthetic subunit in the assessment of the attractiveness of male faces. Meanwhile, the mandibular contour and its shape were the decisive factors in determining whether a female face was considered attractive. These findings coincide with those reported by Johnston et al. [21].
Lastly, it is a well-known fact that average composite faces derived from highly attractive faces are very useful in understanding ethnic beauty configurations [3]. Although some studies have evaluated racial differences in the perception of beauty and facial aesthetics, there are currently no reports on the overall facial shape of the Indian population, with the exception of an anthropometric report describing the average Indian female nose [22]. In order to obtain a visual understanding of attractive Indian faces, we created Indian male and female composite faces using the average morphing method. We produced an average composite Indian male and female face from the top 20 most attractive samples of each gender, which may be considered prototypes of attractive Indian faces. These idealized faces help us to improve the quality of the available data regarding attractive facial norms and reference data for the BAPA program, as well as helping understand attractive facial configurations in the Indian population.
However, our study possessed some limitations. First, the relative number of estimators was small compared to a large number of candidates. We acknowledge that the small number of estimators was the primary drawback of our study. A higher number of rating panels may have resulted in a better verification of the VAS scores, ensuring that our data corresponded more closely to contemporary opinions among the general public. However, we believe that our data do not reflect important statistical errors and provide meaningful information regarding Indian faces because our study included a sufficient number of candidates from an Indian population. Second, some may argue that the BAPA program provided inaccurate findings, as the BAPA scores showed a low Pearson correlation coefficient with the VAS scores. However, our statistical analysis confirmed that facial beauty assessments by humans were somewhat similar to the BAPA scores, meaning that software can analyze human faces similarly to humans. We regard the primary reason for the weak correlation of BAPA scores with VAS scores to be due to the fact that the BAPA program used reference values derived from average Indian values, instead of values from attractive faces. The weak correlation between the BAPA scores and VAS scores may also be explained through some other reasons. First, since the number of the estimators in our study was relatively small, they might not have been completely representative of the opinion of the public. Second, although our VAS data for the 150 candidates possessed a normal distribution and the sample size was large enough for a robust statistical analysis, the low correlation coefficient between BAPA scores and VAS scores may have resulted from the possibility that most candidates in our study may have had somewhat featureless faces. Since there were not enough extremely attractive and/or unattractive faces present among the candidates, as indicated by the fact that the VAS scores and BAPA attractiveness scores showed narrow ranges, we suggest that a weak correlation was an inevitable result. In fact, it was not easy for us to let convince highly attractive or unattractive people to participate in this kind of photogrammetric study. Nevertheless, we expect more precise and accurate analysis and advances in the BAPA program to result from more collaborative studies with Indian colleagues drawing on larger numbers of estimators and regionally specific candidates. Third, some may suggest that since the face is a three-dimensional structure and people usually perceive facial appearance as such, a complete beauty assessment should be achieved by analyzing human faces with three-dimensional methods or at least using both frontal and lateral images. We agree with this point to some extent. Since we only analyzed the frontal face in this study without a profile or lateral facial image of the candidates, despite the fact that the BAPA program automatically provides frontal and lateral faces and can synthesize the two results into a final beauty score, a limitation of our study was that it only reported on frontal facial images. However, although this research possesses certain limitations, we consider this study to be valuable, as it is the first photogrammetric study of the Indian population. Finally, since India is a very large territory populated by many different regional and ethnic groups with varying facial appearances in the northern, southern, and central regions [23], our prototypes of facial attractiveness are not necessarily representative of all attractive Indian faces. For such a large population, we know that area-specific facial characteristics must also be considered. Our composite faces are examples of attractive faces of northern Indians. However, we emphasize the fact that our prototype images are the first to be reported for the Indian population and are very representative of attractive north Indian faces. We expect that our morphed images will assist in the evaluation of attractive facial configurations in the Indian population. Additionally, our experiments suggest that there is considerable room for hope for the further development of a more precise and objective method for the photogrammetric facial analysis of other racial or ethnic groups, if professionals of different nationalities collaborate in analyzing a larger population of candidates.
Cephalometric analysis remains the method of choice for facial analysis. However, it has been argued that the reliability of the photographic technique is excellent and that this technique is extremely useful for epidemiological studies and facial beauty research [24]. Our photogrammetric study, statistical analysis, and average composite faces of Indians provide valuable information regarding perceptions of facial beauty and attractive facial structures in the Indian population.
Notes
This article was presented at the 73rd Congress of the Korean Society of Plastic and Reconstructive Surgeons on November 13–13, 2015 in Seoul, Korea.
We would like to give special thanks to Sujin Han, a certified member of the Society of Translators and Interpreters of British Columbia, for her cordial advice and polished linguistic corrections.
No potential conflict of interest relevant to this article was reported.