Three-Dimensional Surface Imaging is an Effective Tool for Measuring Breast Volume: A Validation Study
Article information
Abstract
Background
Accurate breast volume assessment is a prerequisite to preoperative planning, as well as intraoperative decision making in breast reconstruction surgery. The use of three-dimensional surface imaging (3D scanning) to assess breast volume has many advantages. However, before employing 3D scanning in the field, the tool's validity should be demonstrated. The purpose of this study was to confirm the validity of 3D-scanning technology for evaluating breast volume.
Methods
We reviewed the charts of 25 patients who underwent breast reconstruction surgery immediately after total mastectomy. Breast volumes using the Axis Three 3D scanner, water-displacement technique, and magnetic resonance imaging (MRI) were obtained bilaterally in the preoperative period. During the operation, the tissue removed during total mastectomy was weighed and the specimen volume was calculated from the weight. Then, we compared the volume obtained from 3D scanning with those obtained using the water-displacement technique, MRI, and the calculated volume of the tissue removed.
Results
The intraclass correlation coefficient (ICC) of breast volumes obtained from 3D scanning, as compared to the volumes obtained using the water-displacement technique and specimen weight, demonstrated excellent reliability. The ICC of breast volumes obtained using 3D scanning, as compared to those obtained by MRI, demonstrated substantial reliability. Passing-Bablok regression showed agreement between 3D scanning and the water-displacement technique, and showed a linear association of 3D scanning with MRI and specimen volume, respectively.
Conclusions
When compared with the classical water-displacement technique and MRI-based volumetry, 3D scanning showed significant reliability and a linear association with the other two methods.
INTRODUCTION
Breast reconstruction has become a major issue in the field of plastic and reconstructive surgery given the increased incidence of breast cancer and greater interest in the quality of life following mastectomy. A primary objective of breast reconstruction is to achieve breast symmetry. Thus, accurate and objective volume assessment can be helpful for aesthetically pleasing results in preoperative planning as well as during intraoperative decision-making. A precise measurement of breast volume would also play an important role in augmentation, breast reduction, and congenital asymmetry [1]. The need for more accurate assessment of breast volume has produced several methods for measurement: plaster casting [23], the water-displacement technique [456], anthropometric measurement [78], magnetic resonance imaging [9], computed tomography [10], mammography [11], and ultrasonography [12].
Direct measurement of the breast tissue that is removed could be an accurate method in breast reconstruction, but cannot be employed in patients not undergoing mastectomy nor during the preoperative planning. Furthermore, the tissue removed during the operation could exceed the boundary of the patient's breast for the cancer clearance, resulting in volume over-estimation.
Other tools are available for evaluating breast volume in the preoperative period. The water-displacement technique, which involves immersing the patient's breast and using Archimedes' principle to calculate volume, is one such method. Although there is no cost to performing the procedure, the water-displacement technique is a rather uncomfortable experience for patients. Magnetic resonance imaging (MRI) is known for its accuracy in estimating breast volume [9]. However, its cost per measurement could be expensive, and MRI scans require time-consuming procedures for breast volume measurement. Computed tomography (CT) scans cost less and take less time than MRI scans, but an additional procedure is required to assess breast volume, which could be as time-consuming as MRI scanning.
Recently, three-dimensional surface imaging (3D scanning) has become popular because of its many advantages; the analysis is fast and easy, the technique is less invasive than other methods, and the breast can be analyzed with the patient in the standing position maintaining one's natural breast shape, unlike with MRI or CT. The purpose of this study was to determine the validity of 3D scanning technology and software for evaluating breast volume. To do so, we compared breast volumes calculated from 3D scans to those obtained using the water-displacement technique, MRI, and specimen weight.
METHODS
We reviewed the charts of 25 patients who had undergone breast reconstruction surgery immediately after total mastectomy at our hospital from March 2013 to June 2013. Bilateral breast volumes were obtained in the preoperative period by three methods: the water-displacement technique, MRI-based volumetry, and 3D scanning (Axis Three, AX3 Technologies, Miami, FA, USA). Breast volume was also estimated by weighing the mastectomy specimen intraoperatively and calculating the volume from the weight.
Water-displacement technique
The water-displacement measurement procedure was carried out as follows: The patient was asked to take off her clothes in a private room. The calibrated container was filled to the top with water at room temperature. The patient was asked to flex her upper body and place each breast into the container, ensuring that the upper pole of the breast and inframammary fold touched the container edge. The volume of the water displaced was measured.
MRI-based volumetry
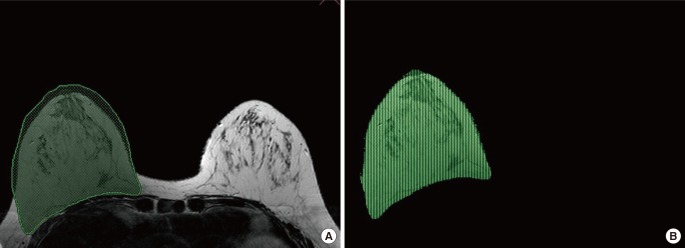
Volume measurement was made using semi-automated software (AW4.6: Volume Viewer; GE Medical Systems, Milwaukee, WI, USA). Non-fat-saturated, T2-wieghted axial slice images with 3-mm thickness were used. The breast tissue boundary was drawn manually on the image showing the highest protrusion. Once the program-generated boundaries had been applied using a fuzzy c-means clustering algorithm (Fig. 1A), each slice was reviewed and manually revised if necessary. The overall breast volume was automatically calculated for each breast (Fig. 1B) and was displayed by the software program. All measurements were made by one radiographer for consistency.
Magnetic resonance imaging-based volumetry
Using semi-automated software (AW4.6: Volume Viewer, GE Medical Systems, Milwaukee, WI, USA), the breast tissue boundary was drawn manually on the image with the highest protrusion (green line) and the program-generated boundaries were applied using a fuzzy c-means clustering algorithm (A). The overall breast volume was automatically calculated for each breast (B).
Three-dimensional surface imaging
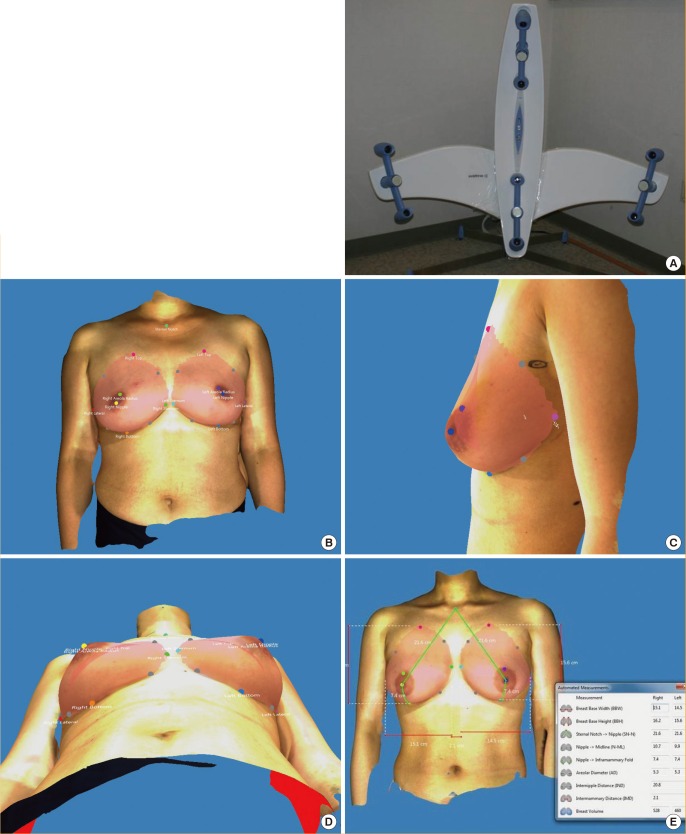
Three-dimensional breast imaging was performed using an Axis Three (AX3 Technologies, Miami, Florida, USA). This scanner has four sets of laser and camera heads that move vertically on pillars (Fig. 2A). Positioning of the patient was standardized by using markers on the floor of the scanner to signify where the patient's feet should be placed. The patient usually stands in front of the scanner with arms hanging naturally. After scanning, anatomically precise models were generated in seconds, using Color Coded Triangulation, a patented Siemens (Berlin, Germany) and Axis Three technology. The 3D image was marked using imaging software (Axis Three) on the following areas: lowest border, nipple, areola margin, sternal notch, and medial and lateral margins (Fig. 2B). The concavity of the posterior surface of the breast was computed with software algorithms. Thus, the curvature of the thorax (contoured cut plane between breast and torso) was measured from the upper to lower and medial to lateral margins of the breast base, respectively (Fig. 2C, D). Based on the points that the examiner selected, the breast volume was calculated (Fig. 2E). The total time for each individual scan was 2 to 3 seconds, and the total procedure time, including marking, was 2 to 3 minutes.
3D scanning instrument and images
The pictured scanner has four sets of laser and camera heads. The scanner's software permits the operator to move the heads vertically to adjust to the patient's height. The scan takes approximately 2 to 3 seconds. (A). The 3D image was obtained using computer software (Axis Three). Landmarks were identified on the 3D image: lowest border, nipple, areola margin, sternal notch, and medial and lateral margins (B). Rotating the 3D image can assist the reviewer in identifying the necessary landmarks on the body. The curvature of the thorax (contoured cut plane between breast and torso) was measured from the upper to lower and medial to lateral margins of the breast base, respectively (C, D) Based on the points that the examiner selected, the breast volume was calculated (E). The total procedure time, including marking, is approximately 2 to 3 minutes.
Mastectomy specimen measurement
The tissue removed during the total mastectomy was weighed on an electronic dial scale intraoperatively, and the volume of the excised breast tissue was calculated using the following formula: breast volume=(weight of the excised breast)/1.07 g/cm3 [13].
Statistical analysis
The level of reliability among the four methods (3D scan, water-displacement technique, MRI, and the volume obtained using specimen weight) was analyzed using the intraclass correlation coefficient (ICC). ICC values of 0.00–0.20, 0.21–0.40, 0.41–0.60, 0.61–0.80, and 0.81–1.00 were used to indicate poor, fair, moderate, substantial, and excellent to perfect reliability, respectively [14]. However, the ICC value could be high if the methods show a similar variation pattern, even if the actual measurement results do not indicate high agreement between methods. Thus, we used Bland-Altman plots to analyze the agreement between the algorithm and the reference standard and to quantify the amount and direction of bias as well as the upper and lower limits of agreement [15]. The 95% confidence interval (CI) of agreement was determined using the mean difference in volumes ±1.96 standard deviation of the volume differences. Passing-Bablok regression is a non-parametric type of regression; we used this method to assess the degree of agreement and linear association between breast volumes obtained from 3D scanning and those obtained using the water-displacement technique, MRI, and specimen weight [16]. All of the statistical tests were regarded as significant at the value of P<0.05. All statistical analyses was performed using Medcalc (Medcalc Software ver. 15.2.2, Mariakerke, Belgium).
RESULTS
A total of 25 women were included in this retrospective review. The mean age of the patients was 42.5±7.5 years (range, 30–58 years). The mean body mass index was 22.3±2.1 kg/m2 (range, 18.0–26.3 kg/m2).
Twenty-four of the patients had both breasts measured using the 3D scan and the water-displacement technique; the remaining patient had only her right breast measured by these techniques. Since MRI was not performed preoperatively on 3 patients, 43 breasts were measured to compare volumes obtained using the 3D scan and the MRI. As the weights of 7 specimens were not recorded, 18 specimens of the removed breast tissue were weighed to compare the volumes obtained using the 3D scan and that obtained from tissue weight.
The mean breast volumes obtained using 3D scanning, the water-displacement technique, MRI, and specimen volume were 332.2±162.2 mL (range, 148–895 mL), 327.3±154.0 mL (range, 120–866 mL), 537.6 ±241 mL (range, 138.3–1,045.1 mL), and 505.5 ±269.4 mL (range, 161.6–1,379.4 mL), respectively.
3D scanning and water-displacement technique
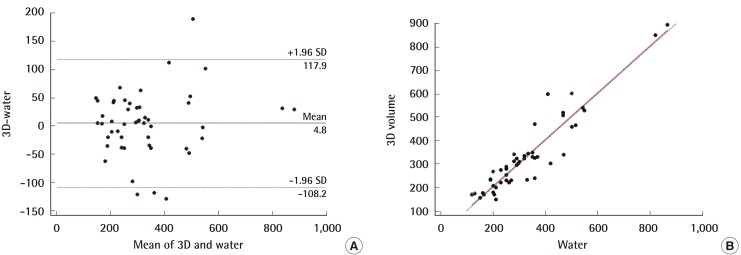
In comparing the breast volume obtained using 3D scanning with that obtained from the water-displacement technique, the ICC demonstrated excellent reliability (0.935; 95% CI=0.887–0.963), and the Bland-Altman analysis yielded a mean difference of 4.8 mL (95% CI=–108.2 to 117.9 mL) (Fig. 3A). Although there was a slight tendency for the 3D-scan volumes to be larger than those obtained by the water-displacement technique, most values fell within the 95% confidence interval and the relationship between 3D scanning and the water-displacement technique was not shown to vary depending on volume. Through Passing-Bablok regression analysis, the following regression equation could be derived: 3D scan=6.00+(1.00× water-displacement technique) (Fig. 3B). The systematic difference and proportional difference were 6.00 (95% CI=–27.462 to 36.788) and 1.00 (95% CI=0.894–1.115), respectively. The 95% CI of the systematic and proportional difference contains the values of 0 and 1. This indicates that the two methods are not significantly different; in other words, they show high agreement.
Comparison of 3D-scanning and water-displacement
In the Bland-Altman analysis (A), most values lie within the 95% confidence interval and the relationship between the 3D scan and the water-displacement technique was not shown to vary depending on volume. Using Passing-Bablok regression, the following regression equation was derived: 3D scan=6.00+(1.00×water–displacement technique) (B). We were able to find agreement between the two methods. SD, standard deviation.
3D scanning and MRI
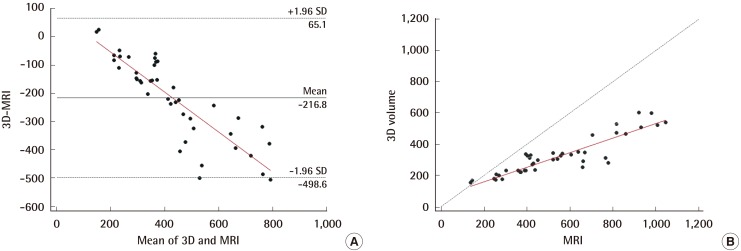
In comparing the breast volume obtained using 3D scanning with that obtained from MRI, the ICC analysis demonstrated substantial reliability (0.715; 95% CI=0.530–0.835), and the Bland-Altman analysis yielded a mean difference of -216.8 mL (95% CI=-498.6 to 65.1 mL) (Fig. 4A). Most values fell within the 95% confidence interval. However, the breast volume obtained from MRI was generally larger than that from 3D scanning, and the volume difference between the two methods became larger as the breast volume increased. Through Passing-Bablok regression analysis, the following regression equation was derived: 3D scan=64.86+(0.47×MRI) (Fig. 4B). The systematic difference and proportional difference were 64.861 (95% CI=42.426–98.564) and 0.468 (95% CI=0.408–0.527), respectively. The 95% CIs of the systematic and proportional difference do not contain the value of 0 or 1. This indicates that two methods are significantly different; in other words, they show low agreement.
Comparison of 3D-scanning and MRI-volumetry
In the Bland-Altman analysis (A), most values lie within the 95% confidence interval and the relationship between the 3D scanning and the water-displacement technique was shown to vary depending on the volume. Using Passing-Bablok regression, the following regression analysis was derived: 3D scan=64.86+(0.47×MRI) (B). We were able to find a linear association and significant difference between the two methods. MRI, magnetic resonance imaging; SD, standard deviation.
3D scanning and specimen volume
In comparing the breast volume obtained from 3D scanning with that obtained from the specimen, the ICC analysis demonstrated excellent reliability (0.896; 95% CI=0.743–0.960), and the Bland-Altman analysis yielded a mean difference of -118.3 mL (95% CI=-263.1 to 26.5 mL) (Fig. 5A). Most values lie within the 95% confidence interval. However, there was a tendency for the breast volume obtained from the specimen to be larger than that from the 3D scan, and the volume difference between the two methods increased as the breast volume increased. Using Passing-Bablok regression analysis, the following regression equation could be derived: 3D scan=1.55+(0.72× specimen) (Fig. 5B). The systematic difference and proportional difference were 1.552 (95% CI=–54.258 to 66.517) and 0.718 (95% CI=0.560–0.838), respectively. The 95% CI of the systematic difference contains the value of 0, but the proportional difference does not contain the value of 1. This indicates Specimenthat there is no significant systematic difference but a significant proportional difference between the volumes obtained using 3D scanning and specimen weight; in other words, they show low agreement.
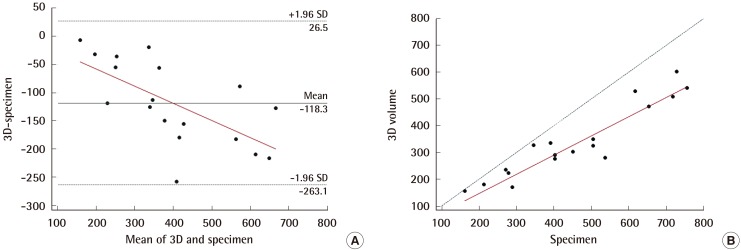
Comparison of 3D-scanning and specimen volume
In the Bland-Altman analysis (A), most values lie within the 95% confidence interval, and the relationship between the 3D scan and the water-displacement technique was shown to vary depending on volume. Through Passing-Bablok regression, the following regression equation was derived: 3D scan=1.55+(0.72×specimen) (B). We were able to find a linear association and significant difference between the two methods. SD, standard deviation.
DISCUSSION
Among many methods of measuring breast volume, the water-displacement technique costs little, and the amount of time required to perform the measurement is less than 5 minutes. Bulstrode et al. [17] reported that the results obtained using this method demonstrated adequate acceptability, but they do not recommend this method because of the difficulty and discomfort some patients experience during measurement. In addition, the water-displacement technique assumes that the posterior surface of the breast is flat. Thus, deviations from the actual breast volume can be expected. MRI scanners are widely available, so patients would not incur setup costs. Cost-per-measurement could be negligible if the MRI is included in the evaluation and treatment for breast cancer; however, if MRI is not included in the evaluation of the breast cancer, the MRI would make measuring the volume of the breast expensive. The scan takes approximately 20 minutes, which can be uncomfortable for patients, particularly those who are claustrophobic [18] or uncomfortable with the noise [19]. Obtaining the volume with DICOM data using MRI scanning would be time-consuming, as other software is needed and additional efforts are required for the computation process. Furthermore, the position of the patient during the imaging process contributes to unsatisfactory results [20]. For CT scanning, a setup cost would not be required and the cost per measurement could be negligible, if the CT scan is included in the routine evaluation of breast cancer. In addition, CT scanning is faster and costs less than MRI. To evaluate the adequacy of perforators for deep inferior epigastric artery perforator (DIEP) flap, a CT evaluation is required in a patient's preoperative workup during the preoperative planning process [212223]. With this CT image, breast volume can be measured without additional cost. This should facilitate elaborate planning and improve clinical outcomes in DIEP flap breast reconstruction [24]. However, CT scanning has lower sensitivity for adipose tissue compared to MRI, and it results in relatively high radiation exposure. In addition, patients should be positioned in the prone or supine position for the CT scan.
Using a 3D scan to determine breast volume has several benefits, including simplicity, non-invasiveness, having the patient in a standing position, of the lack of ionizing radiation, speed and ease of follow-up, and safety. Kovacs et al. [25] noted that the cost of a 3D scanner, about US$75,000, while possibly prohibitive to some, must be weighed against the cost of revisionary procedures for patients with suboptimal reconstructive results in complex breast surgery.
In our study, based on the ICC analysis, we found the 3D scan has excellent reliability compared to the classical water-displacement technique and specimen volume. We found the 3D scan to have substantial reliability compared with MRI.
From Bland-Altman analysis and Passing-Bablok regression, we found that the 3D scan showed excellent agreement with the classical water-displacement technique, while it showed a significant difference when compared with MRI and specimen volume. Although we could not assess the agreement of 3D scanning with MRI and specimen volume, we were able to find that there was a linear association between them. The breast volume obtained using MRI was generally larger than that obtained by 3D scanning. Since MRI scans were taken with the patient in the prone position, we assume that the sagging of the breast tissue due to gravity would result in volume over-estimation compared to the breast volume obtained from the 3D scan, which was performed with the patient in the standing position. The volume obtained using specimen weight was also generally greater than that from 3D scanning; this may have been caused by the fact that the tissues near the clavicle area, beyond the anterior axillary line and even below the inframammary fold were included in the specimens, depending on the surgeon's preference.
Several prior studies have similarly compared the 3D scan to other methods for measuring breast volume, but most studies showed only an association, not agreement between methods. Losken et al. [26] compared breast volume obtained from 3D scanning with that obtained by intraoperative specimen measurements using Bland-Altman analysis in 19 specimens, and reported that 3D scanning is reasonably accurate and reproducible based on the Pearson correlation and Bland-Altman analysis. Kovacs et al. [25] compared 3D scanning with MRI, thermoplastic casts, and anthropomorphic methods from measuring 12 breasts in 6 patients. They reported that MRI-based volumetry showed the best agreement with the 3D scan; however, they only performed simple linear regression analysis to search for only a linear association, but not the potential agreement between methods. The regression equation they provided is as follows: 3D scan=9.83+(0.75×MRI). Yip et al. [1] also compared breast volumes obtained from 3D scanning with those obtained by intraoperative specimen measurements, and reported a strong linear association between them based on Pearson correlation and Bland-Altman analysis.
One of the limitations of our study is the potential lack of reproducibility (inter-observer reliability) in determining the boundaries of the breast on a 3D scan. In the Axis Three, the investigator should choose six points on each breast: the lowest border, nipple, areola margin, sternal notch, and medial and lateral margins. Of these points, the lateral margin and calculated upper margin could vary from investigator to investigator. To reduce the inter-observer differences, we need to standardize the points of 3D simulation. Although Losken et al. [26] reported, from measuring 19 breasts, that 3D scanning has reproducibility of measurements (based on two measurements) for each reader and shows highly significant inter-observer reliability (between two raters), an additional larger scale study could be helpful to assess the inter-observer reliability. Secondly, calculating the volume using the specimen weight with the mean density of other people's breast specimens could produce errors. Each person has a different density of breast tissue. Thus, measuring the volume with the Archimedean principle in intraoperative period would be a more accurate approach than calculating it using the specimen weight.
There was a sufficient agreement between breast volumes obtained from the 3D scan and those obtained by the classical water-displacement technique. The volumes obtained from 3D scanning also showed sufficient reliability and a linear association with those obtained using the MRI and specimen weight. Although 3D scanning has some limitations, its advantages, including simplicity, speed, and ease of performance, would aid in measuring breast volume in preoperative planning as well as in evaluating volumetric change in postoperative follow-up, on a routine basis. Further verification of the use of 3D scan in breast volume measurement would be warranted.
Notes
This article was presented at the 2014 Korean Society of Plastic and Reconstructive Surgeons International on November 7–9, 2014 in Seoul, Korea.
No potential conflict of interest relevant to this article was reported.