Epidemiologic study of hand and upper extremity injuries by power tools
Article information

Abstract
Background
Hand injuries caused by chain saws, electric saws, and hand grinders range from simple lacerations to tendon injuries, fractures, and even amputations. This study aimed to understand the distribution of various types of hand and upper extremity injuries caused by power tools, in order to help prevent them, by investigating the incidence and cause of power tool injuries treated over a 4-year period at a single institution in Korea.
Methods
We reviewed the medical records of patients who visited a single institution for power tool-induced injuries from 2011 to 2014. The distribution of sex, age, injured body part, type of injury, and mechanism of injury sustained by patients who received hand and upper extremity injuries from using an engine saw, electric saw, or hand grinder was evaluated.
Results
Among 594 subjects who were injured by power tools, 261 cases were hand and upper extremity injuries. The average age was 53.2 years. Tendon injury was the most common type of injury. An electric saw was the most common type of power tool used. More injuries occurred in non-occupational settings than in occupational settings.
Conclusions
In this study, power tool-induced hand and upper extremity injuries were mostly caused by direct contact with electric saw blades. More injuries occurred due to non-occupational use of these tools, but the ratios of amputations and structural injuries were similar in the non-occupational and occupational groups.
INTRODUCTION
Hand injuries are among the most frequent injuries of the human body [1,2]. Working male aged ≤40 years are most likely to sustain hand injuries [3-5]. The National Institute for Occupational Safety and Health reported that upward of 10,000 work-related finger amputations are performed annually among persons ≥15 years of age in U.S. hospital emergency departments [6]. These injuries occur mainly during industrial activities; however, they also occur at home [2-4,7], in public venues [3,7], and during sports activities [2,4,8,9]. In non-occupational injuries, fingers are the body part most vulnerable to injury and subsequent traumatic amputation. More than 90% of all nonoccupational amputations treated in U.S. hospital emergency rooms involve fingers [10]. According to the U.S. Consumer Product Safety Commission, 64,100 injuries involving electric saws were reported in 2001 [11]. Power tools—engine saws, electric saws, and hand grinders—are hand-held or table-mounted saws that use a toothed metal disc or blade to cut wood or other materials. These tools are frequently used not only in the workplace, but also for woodworking or recreational activities at home. Hand injuries caused by these power tools are diverse, and range from simple lacerations to tendon injuries, fractures, and amputations. This study aimed to understand the distribution of various types of hand and upper extremity injuries caused by power tools, in order to help prevent them, by investigating the incidence and cause of power tool injuries treated over a 4-year period at a single institution in Korea.
METHODS
A single-center retrospective review was performed of all patients who were treated for power tool-induced injuries between February 2011 and December 2014. This study was approved by the Institutional Review Board (IRB No. CR 318100). Injuries caused by power tools to the hand and upper extremities were included, while lower extremity injuries were excluded. All cases involving an upper extremity injury from a power tool that required operation, including simple lacerations, were included in this study. Data regarding patients’ age, sex, injured body part, type of injury, and mechanism of injury were evaluated. According to the place where the accident took place, subjects were categorized into an occupational group and a non-occupational group. The occupational group was defined as patients whose injury occurred in their workplace (e.g., factory, construction site, butcher shop, or military base). The non-occupational group was defined as patients who sustained injuries at home. An analysis was performed to compare the types and severity of injuries between the two groups. The chi-square test with the Yates continuity correction was used to identify statistically significant differences between the occupational and non-occupational groups.
RESULTS
Patient characteristics
From February 2011 to November 2014, a total of 594 patients visited Wonju Severance Christian Hospital with power tool injuries. Of these, 261 cases (43.9%) were hand and upper extremity injuries. Among the 261 cases, finger injuries (n=218, 84%) were most frequently observed, followed by forearm injuries (n=22, 8%) and wrist injuries (n=18, 7%) (Table 1). Almost all of the patients (n=261, 97%) were male. Their mean age was 53.2 years (range, 19–86 years). There were more patients in the non-occupational group (n=137, 52%) than in the occupational group (n=124, 48%). The annual distribution of patients during the 4-year period (from 2011 to 2014) increased each year in general, and the monthly incidence rate was highest in May of each year, followed by October and April (Fig. 1).
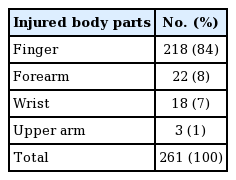
Injured body parts
Annual and monthly distribution of patients
(A) The annual distribution of patients during the 4-year period (from 2011 to 2014) increased from 2011 to 2013, and then slightly decreased from 2013 to 2014. (B) The monthly incidence was highest in May, followed by October and April.
Types of injuries
The most common type of injury was tendon injury (n=111, 41.4%); of these, extensor tendon injuries (n=78, 70%) were observed more frequently than flexor tendon injuries (n=33, 30%). The next most frequently-occurring types of injury, in order of frequency, were fractures (75 cases, 28.0%), amputations (30 cases, 11.2%), muscle injuries (23 cases, 8.6%), nerve injuries (12 cases, 4.5%), and vessel injuries (15 cases, 5.6%) (Fig. 2). Simple lacerations that needed only primary repair occurred in 57 cases (21.2%). The following types of combined injuries occurred: fractures with an extensor tendon injury (n=30, 11%), tendon injuries with a nerve or vessel injury (n=11, 4%), fractures with a flexor tendon injury (n=10, 4%), flexor injuries with a nerve or vessel injury (n=7, 3%), fractures with a nerve or vessel injury (n=5, 2%), extensor injuries with a nerve or vessel injury (n=4, 2%), and fractures with both flexor and extensor tendon injuries (n=2, 1%) (Fig. 3). Among a total of 243 injured fingers, the thumb (n=62, 26%) and index finger (n=67, 28%) accounted for over half of all injuries (combined: n=129, 53%), followed by the long finger (n=52, 21%), ring finger (n=37, 15%), and small finger (n=25, 10%) (Fig. 4).
Types of injury by power tools
The most common type of injury was extensor tendon injuries.
Prevalence of combined injuries by power tools
The most common type of combined injuries was fractures with a tendon injury.
Distribution of fingers injured by power tools
The thumb and index finger accounted for over half of all injuries (thumb: 1st finger, index: 2nd finger, long: 3rd finger, ring: 4th finger, small: 5th finger).
Causes of injuries
Electric saws were the most common type of power tool that caused the injuries (142 cases, 53.0%), followed by hand grinders (84 cases, 31.3%) and engine saws (42 cases, 15.7%). As for the mechanism of injury, blade contact (215 cases, 80.2%) was the most common, followed by power tool kickback (22 cases, 8.2%) and the power tool cutting into gloves (14 cases, 5.2%) (Fig. 5).
Mechanisms of injury by power tools
The most common mechanism of injury was blade contact.
Comparison between the non-occupational group and occupational group
A total of 137 injuries occurred in the non-occupational group, which was more than in the occupational group (124 cases). The average age of the occupational group was 50.2 years, compared to 55.7 years for the non-occupational group. The number of simple laceration injuries was greater in the occupational group (30 cases, 24.2%) than in the non-occupational group (27 cases, 19.7%). The number of amputations was similar in the occupational group (14 cases, 11.2%) and in the non-occupational group (16 cases, 11.2%). Furthermore, the ratio of injuries between the two groups (occupational group to non-occupational group) was 24.8%:30.8% for fractures, 12.0%:12.6% for flexor tendon injuries, 22.4%:35.0% for extensor tendon injuries, 8.0%:9.1% for muscle injuries, 5.6%:3.5% for nerve injuries, and 5.6%:5.6% for vessel injuries. To compare the two groups in terms of the severity of injuries, the cases in each group were further divided into two groups: simple injuries and combined injuries. There was no statistically significant difference in the severity of injuries sustained by patients in the occupational and non-occupational groups (P=0.2167) (Table 2).
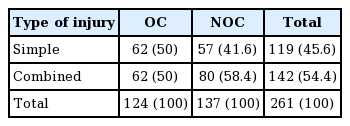
Statistical comparision between two groups
DISCUSSION
In this study, we analyzed the mechanism and frequency of power tool-induced hand injuries, which frequently occur in Gangwon Province, Korea. Forestry jobs are common in the part of the province where our institution is located and, buoyed by the extensive presence of rural agricultural communities, many urban residents relocate to the province in search of a rural life. We confirmed that the incidence of hand and upper extremity injuries was higher in spring and fall than in summer and winter due to the relatively more comfortable working conditions in mild weather. The proportion of female patients was very low, since it is usually men who handle power tools. We also found that electric saws were the most frequent cause of injuries. Possible explanations may include the widespread use of these tools in home woodworking and gardening (pruning). Electric saws can also be used in various postures, making users more susceptible to mistakes. Prior to this study, we decided to make a distinction between occupational and non-occupational injuries according to the place where the injury occurred on account of our impression that many emergency-room patients present with injuries from woodworking at home as a non-occupational pastime activity or a retirement hobby. For a comparative analysis, we hypothesized that the non-occupational group would suffer more severe injuries than the occupational group, since non-occupational users of power tools are less likely to have received systematic training and, partly for this reason, pay less attention to the proper use of protective equipment than the occupational group. Extant research findings seem to provide some support to this hypothesis. A previous study listed three major causes of serious injuries from a power tool: (1) inattention through repetition; (2) an unanticipated event; and (3) inexperience or overconfidence [12]. Other risk factors include bad judgment brought on by fatigue, postprandial somnolence, amateur status, improper use of equipment, and kickback [13]. Although hand injuries are often caused by non-compliance with the standard principles of work safety, human error causes up to 90% of minor hand injuries [14]. To some extent, hand injuries can be prevented by proper and consistent safety training, using proper safety equipment, and installing proper safety protections [5,9,15,16]. However, our comparison of the occupational and non-occupational groups did not reveal any statistically significant difference in combined injuries or amputations. This finding contradicts our hypothesis and suggests that, as far as injuries are concerned, there may be no difference between more sophisticated, difficult work over long hours performed by the occupational group and the relatively simpler work conducted by the non-occupational group. This difference, or the lack thereof, should be further explored in future studies. As discussed above, we noticed a continued upward trend in hand injuries caused by power tools over the 4-year period of this study, partially influenced by the increasing popularity of do-it-yourself projects in woodworking and interior design in recent years. Our findings that most injuries were caused by direct blade contact and that extensor injuries were more frequent than flexor tendon injuries enable us to assume that the injuries often arose from minor mistakes, such as putting a hand in a wrong place when grabbing a material or allowing a blade to contact a body part while trying to drive it into the material at hand. We thus anticipate that basic training on the use of power tools could prevent most hand injuries, including the recommendation that users set an appropriate limit to their work hours to enhance concentration and maintain a stable posture while handling the tools to prevent their arms from becoming shaky. We believe that our study represents a good starting point for future studies on power tool-induced hand injuries in Korea. Furthermore, although we failed to identify a statistically significant difference between the occupational and non-occupational groups, we look forward to more accurate information about this issue through future research endeavors, for which we propose the collection of history and data on emergency room treatment in further depth, including the type of work involved in injuries. Gangwon Province, the geographical scope of our study, is characterized by frequent use of power tools in both occupational and non-occupational settings. We thus believe that research in this region will contribute to the analysis of power tool-induced hand injuries across the country. In our study, the incidence rate of hand injuries demonstrated seasonal variation, with significantly more injuries occurring in spring (April and May) and autumn (October) than in other seasons. This may be attributable to the mild weather that provides suitable conditions for activities including woodworking. Due to the nature of power tools, which require a certain amount of physical force to operate and thus involve risks of injury, a large number of patients seemed to be middle-aged male (mean age, 53.2 years; n=261, 97%). Of the types of power tools, electric saws were the most common cause of power tool injuries (112 cases, 41.8%) to the hand and upper extremity. Circular saws, a type of electric saw that can be bought in the form of smaller and cheaper “consumer models,” are frequently sold due to the increasing popularity of do-it-yourself recreational activities. Therefore, hand injuries due to these power tools are a common reason for patients to seek medical care in emergency departments [17]. To prevent the hand and upper extremity injuries by power tools it needed consistent safety training using proper safety equipment and installing proper safety protections.
Notes
No potential conflict of interest relevant to this article was reported.
Ethical approval
The study was approved by the Institutional Review Board of Wonju Severance Christian Hospital Hospital (IRB No. CR 318100) and performed in accordance with the principles of the Declaration of Helsinki. Written informed consents were obtained.