Analysis of 344 Hand Injuries in a Pediatric Population
Article information
Abstract
Background
The purpose of this study was to identify comprehensive hand injury patterns in different pediatric age groups and to assess their risk factors.
Methods
This retrospective study was conducted among patients younger than 16-year-old who presented to the emergency room of a general hospital located in Gyeonggi-do, Republic of Korea, and were treated for an injury of the finger or hand from January 2010 to December 2014. The authors analyzed the medical records of 344 patients. Age was categorized according to five groups.
Results
A total of 391 injury sites of 344 patients were evaluated for this study. Overall and in each group, male patients were in the majority. With regard to dominant or non-dominant hand involvement, there were no significant differences. Door-related injuries were the most common cause in the age groups of 0 to 3, 4 to 6, and 7 to 9 years. Sport/recreational activities or physical conflict injuries were the most common cause in those aged 10 to 12 and 13 to 15. Amputation and crushing injury was the most common type in those aged 0 to 3 and 4 to 6 years. However, in those aged 10 to 12 and 13 to 15, deep laceration and closed fracture was the most common type. With increasing age, closed injuries tended to increase more sharply than open injuries, extensor tendon rupture more than flexor injuries, and the level of injury moved proximally.
Conclusions
This study provides a comprehensive overview of the epidemiology of hand injuries in the pediatric population.
INTRODUCTION
Except for primitive reflexes, all body movements are involuntary in the newborn. The infant builds up motor functions in a cephalic to caudal direction. Motions of the hand such as fist opening (at about 4 months of age) are one of the earliest developments of humans in exploring and communicating with the external world. Immature and poorly controlled searching movements can sometimes be a cause of injuries of the hand. Hand injuries are among the most common childhood injuries encountered in pediatric emergency departments, with the potential for causing permanent morbidities such as scar contracture or restriction of growth of the hand even when the injuries were trivial events [12].
The industrialization and westernization of Korean society has affected its disease and injury patterns, and several cases of pediatric hand injuries caused by specific machines, such as electronic rice cookers [34] and a treadmill [5] have been reported. Although they raised public awareness of the danger of several products, these reports did not paint a comprehensive picture of the epidemiology and characteristics of pediatric hand injuries.
Some common findings can be deduced from several large scale studies [2678]. Usually boys are more prone to injury than girls, injuries most commonly occur in the home, and the male-to-female ratio increased with increasing age. However, different details were reported in different countries and environments.
The objectives of this study were to compile comprehensive hand injury patterns in the general Korean pediatric population and to assess environmental risk factors and circumstances contributing to the incidence of severe hand injuries requiring hospitalization.
METHODS
This study included hand injury cases in children younger than 16 years of age treated for an injury to the finger or hand from January 2010 to December 2014, requiring surgery. Some of them visited the emergency department directly, but others were referred from other clinics or hospitals after primary care or failed treatment. The authors performed a retrospective analysis of the medical records of 344 patients, and gathered information about the patient's age, gender, specific injured body part, diagnosis, and operation records. Age was categorized according to five groups: 0 to 3 years (toddlers), 4 to 6 years (preschool children), 7 to 9 years (early elementary school), 10 to 12 years (late elementary school), and 13 to 15 years (adolescence). The following analyses were performed for each age group: mean number of operations, dominant or non-dominant hand involvement, closed or open injury, flexor or extensor injury, injury type (e.g., amputation, crushing, deep laceration, skin or soft tissue defect, fracture, etc.), and cause of injury (e.g., door-related injury, sharp object, furniture, machinery, electric fan, bicycle chain or sprocket, escalator, etc.). Amputation was defined as complete or incomplete division of part of the finger, requiring microanastomosis of vessels for replantation or composite graft. Crushing was defined as an injury not requiring microvascular anastomosis but requiring bony reduction and/or composite graft. Deep laceration included cases requiring tenorrhaphy or neurorrhaphy with skin closure.
Statistical analyses of data were performed using IBM SPSS ver. 20.0 for Windows (IBM Co., Armonk, NY, USA). Patients' demographic characteristics were analyzed using descriptive statistics. Variables were evaluated using the chi-squared test, Spearman's Rho test, etc.
RESULTS
Patient characteristics
A total of 391 injuries of 344 patients were evaluated for this study. The mean age was 7.53 years (range, 6 months–15 years 11 months). The annual distribution of patients during the 5-year period (from 2010 to 2014) showed no significant difference in the number of patients (Fig. 1).
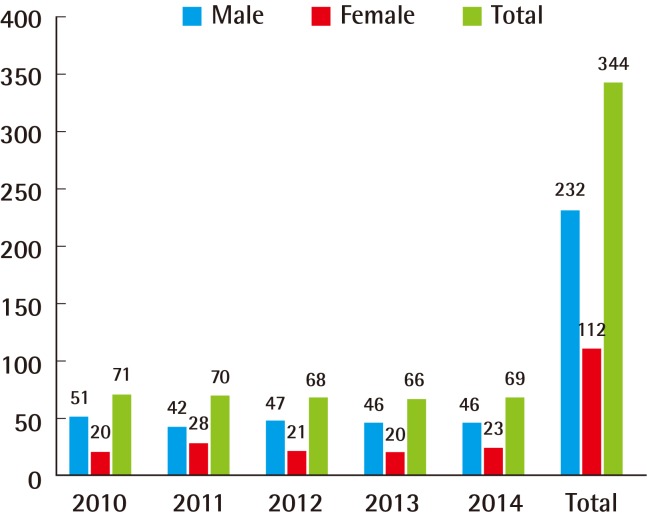
The annual distribution of patients during the 5-year period.
No significant variation in the number of patients was found.
Different numbers of injured children were observed according to age group: 0 to 3 years (n=122, 35.5%), 4 to 6 years (n=49, 14.2%), 7 to 9 years (n=47, 13.7%), 10 to 12 years (n=57, 16.6%), and 13 to 15 years (n=69, 20.1%). Males accounted for 67.4% (n=232) of total hand injury cases. The overall ratio of males to females was 2.07, and the ratio varied according to age group (Fig. 2).
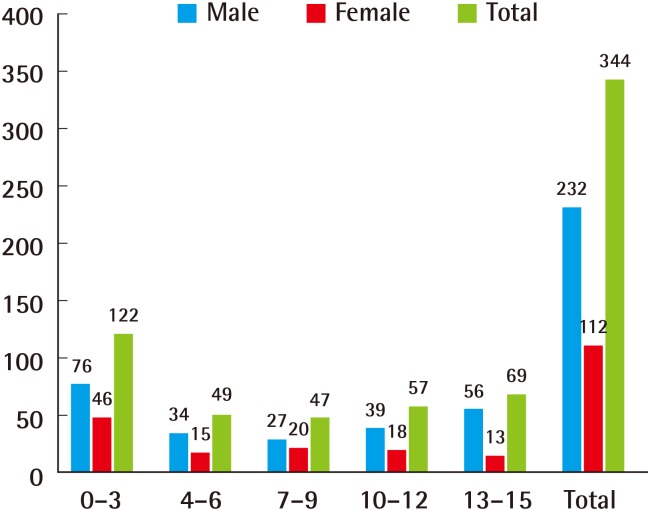
Male-to-female ratio according to age group
0 to 3 years (1.65), 4 to 6 years (2.27), 7 to 9 years (1.35), 10 to 12 years (2.17), and 13 to 15 years (4.31). The age group 13 to 15 years showed a significantly higher ratio compared with the younger age groups (P=0.007).
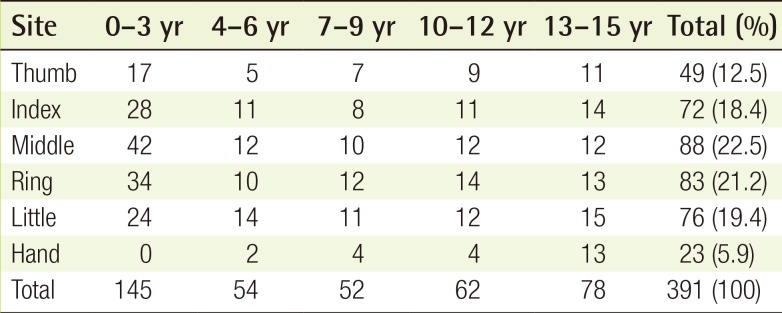
The mean number of operations was evaluated to indirectly estimate the severity of the injuries. The overall mean number of operations was 1.16, and the mean number differed significantly among age groups. In the age groups under 6 years, the mean number of operations (1.24) was considerably higher than that of the older age groups (1.07), and the mean number decreased with increasing age (Spearman's Rho Testing, ρ=–0.900, P=0.037). With regard to dominant or non-dominant hand involvement, dominant hands were injured in 175 (50.9%) patients and non-dominant hands were injured in 169 (49.1%) patients (Fig. 3). The most commonly injured digit was the middle finger, followed by the ring, little, index finger, thumb, and hand (Table 1).
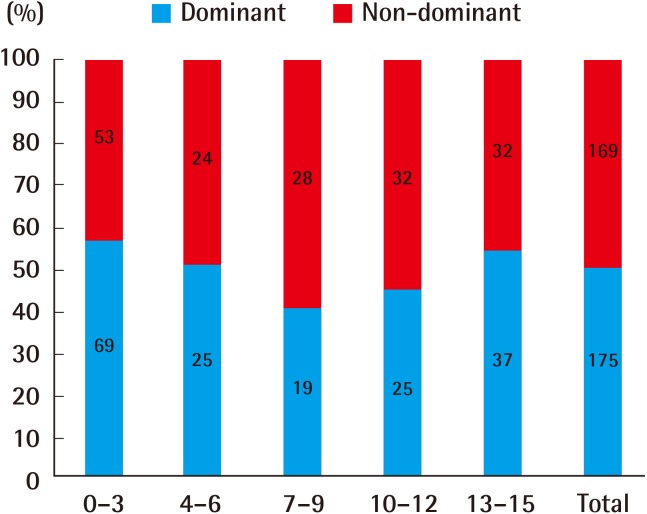
Proportion of dominant vs. non-dominant hand
There were no significant differences in any of the age groups.
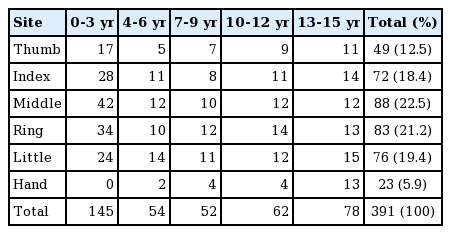
Distribution of injury sites
Injury characteristics
Closed or open injuries showed a tendency of being age group related. Open injuries were observed more often (n=263, 76.5%) than closed injuries (n=81, 23.5%). In the youngest age group, 0 to 3 years, open injuries occurred in 120 (98.4%) patients and only two (1.6%) closed injuries were diagnosed. In the oldest age group, 13 to 15 years, open injuries occurred in 32 children (46.4%) and closed injuries occurred in 37 children (53.6%) (Fig. 4).
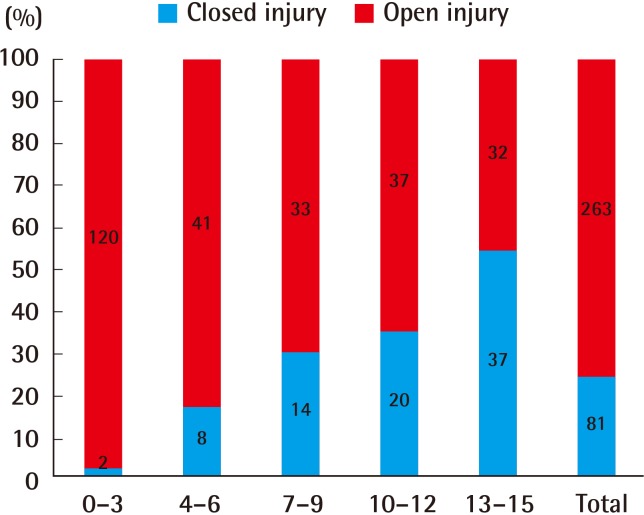
Proportion of closed vs. open injury
With increasing age, open injuries decreased and closed injuries increased.
In total, 68 children suffered from tendon injuries by sharp objects. The younger children more often showed flexor injuries and the older children more often experienced extensor injuries than flexor injuries (Fig. 5).
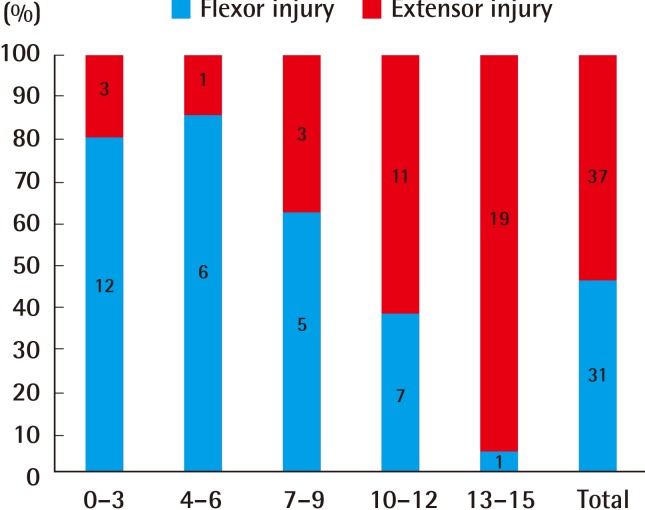
Proportion of flexor vs. extensor tendon injury
With increasing age, flexor injuries decreased and extensor injuries increased.
The injury levels, from distal to proximal, differed according to age group. The injury levels were classified into four groups: from the fingertip to the distal interphalangeal joint (DIP joint), from the DIP joint to the proximal interphalangeal joint (PIP joint), from the PIP joint to the metacarpophalangeal joint (MP joint), and from the MP joint to the wrist. Multiple-level injuries (n=3) were excluded. In the most distal part, injury tended to occur more frequently in younger children, and the incidence of injuries decreased with increasing age. At the most proximal level, from the MP joint to the wrist, the incidence of injuries increased with increasing age (Fig. 6).
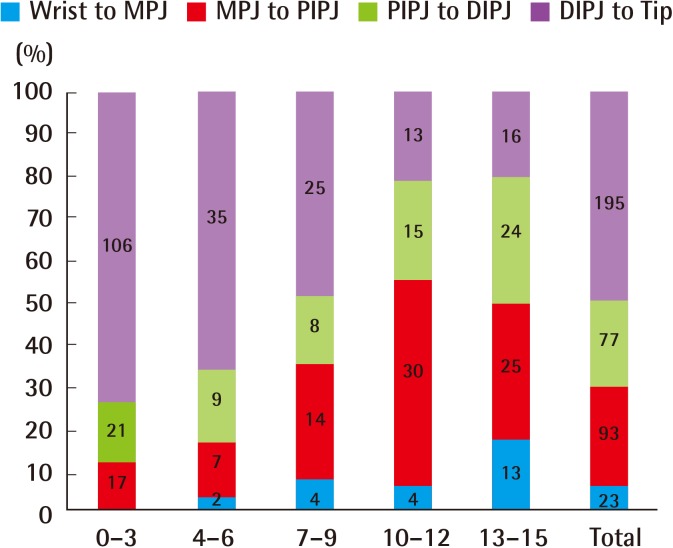
Proportion of injury level
The younger children tended to be injured more frequently at the most distal level, and with increasing age the incidence of injuries at this level decreased.
Type and cause of injury
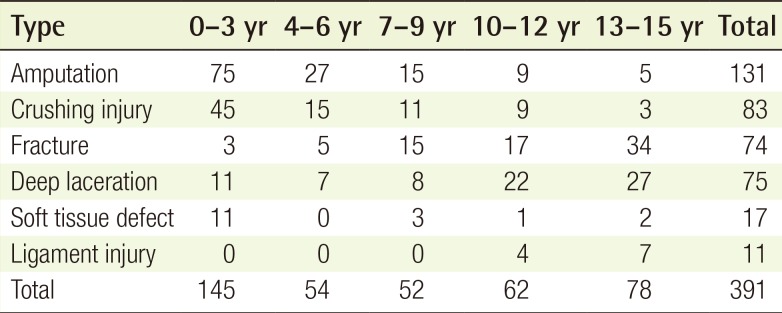
The number of each type of injury summed together was higher than the total number of patients. This is because there were cases of multiple injuries in one child. In the youngest age group, 0 to 3 years, amputations (n=75, 51.7%) were the most common type of injury. In the age group of 4 to 6 years, amputations (n=27, 50.0%) were also observed most frequently. In the age group of 7 to 9 years, amputations (n=15, 28.9%) and fractures (n=15, 28.9%) were most commonly observed. Deep lacerations (n=22, 35.5%) were the most common type of injury in the age group of 10 to 12 years. In the oldest age group of 13 to 15 years, fractures (n=34, 43.6%) were observed most frequently and deep lacerations (n=27, 34.6%) were also common. The proportion of amputations (0 to 3 years (51.7%), 4 to 6 years (50.0%), 7 to 9 years (28.9%), 10 to 12 years (14.5%), and 13 to 15 years (6.4%)) decreased with increasing age (Spearman's rho test, ρ=-1.000, P=0.01). However, the proportion of fractures in the groups of 0 to 3 years (2.1%), 4 to 6 years (9.3%), 7 to 9 years (28.9%), 10 to 12 years (27.4%), and 13 to 15 years (43.6%) increased with increasing age (Spearman's rho test, ρ=0.900, P=0.037). Ligament injuries alone without fracture occurred in children older than 10 years (Table 2).
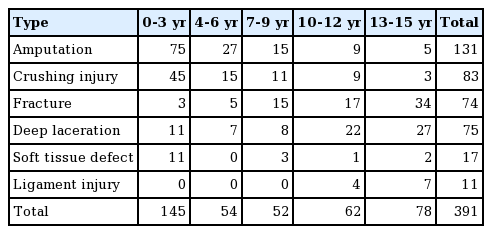
Types of injuries
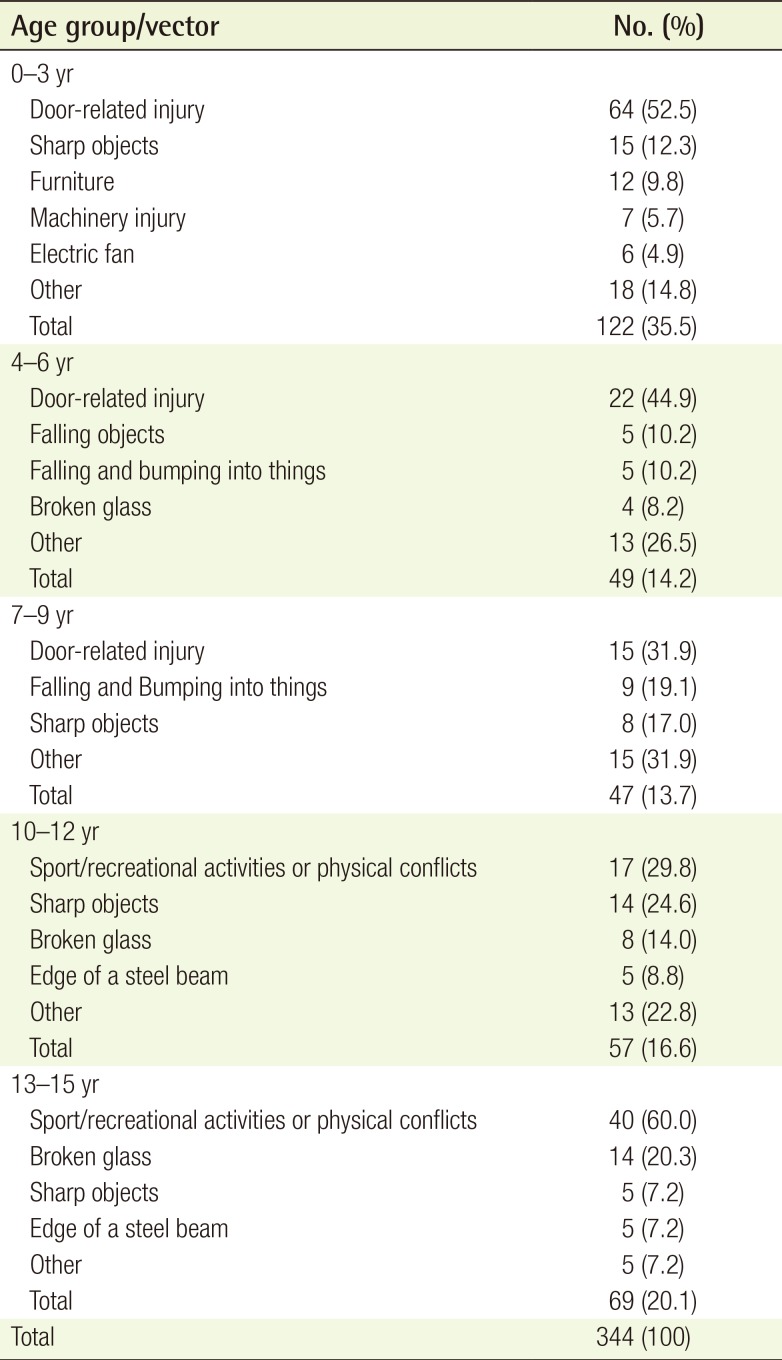
Causes of injury varied by age group and showed specific patterns. In the youngest age group, 0 to 3 years, door-related injuries (n=64, 52.5%) were most common, followed by sharp objects, including utility knives, kitchen knives, razor blades, scissors, and eyebrow knives (n=15, 12.3%), furniture (n=12, 9.8%), machinery, including car fan belts, pasta makers, juicers, persimmon peelers, etc. (n=7, 5.7%), electric fans (n=6, 4.9%), bicycle chains or sprockets (n=4, 3.2%), escalators (n=3, 2.4%), and others (n=11, 9.0%). In the age groups of 4 to 6 years and 7 to 9 years, door-related injuries occurred most frequently as well. In the age groups over 10 years, sport/recreational activities or physical conflicts were the most common cause of hand injuries. Interestingly, in the oldest age group, some cases were associated with alcohol use, although the exact proportion could not be determined (Table 3).

Causes of injuries
DISCUSSION
The number of injured children differed according to age group. The youngest group (35.5%) and the oldest group (20.1%) constituted more than half of the total number of patients. These findings may be different from the overall incidence of hand injuries in the pediatric population of Korea in general. Another large scale study conducted in the US showed that the average annual injury rate for patients younger than 5 years was 7.75 per 1,000 population and was 7.7, 16.35, and 16.25 per 1,000 population for the age groups 5 years to 9 years, 10 years to 14 years, and 15 years to 17 years, respectively [2]. Although the age groups were different from those of our study, the incidence increased with increasing age. In this study, it can be explained in part by the fact that a substantial portion of patients were referred from other clinics or hospitals. In the youngest age group, severe injuries, such as amputation (51.7%) or crushing injuries (31.0%) requiring hospitalization, made up the largest proportions of the injuries.
In Korean children, male-to-female ratio of every age groups is about 1.1. In comparison, there was a statistically significant male predominance in the total number of injuries. In addition, this study showed consistent results with other studies conducted in different countries and environments [910111213]. It may be difficult to explain the male dominance in the youngest age group because male or female children do not show significantly different activity patterns, although males are more active. However, over the age of ten years (the male-to-female ratios in the age group of 10 years to 12 years and of 13 years to 15 years were 2.17 and 4.31), boys are usually more involved in activities of physical conflict or dangerous play to boast of their toughness and strength. This can provide a probable explanation for the higher incidence of hand injuries in the male children.
The authors measured the mean number of operations to indirectly estimate the severity of the injuries. The duration of hospital stay can provide more specific clues regarding the severity of the injury. However, many of the patients were students and the parents or guardians did not want their children to be absent from nursery school or school. It may not be the perfect measure, but the mean number of operations can explain the severity of the injury to a certain degree. Patients in the youngest age group suffered from more severe injuries and the mean number of their operations was significantly higher compared with patients in the other groups.
However, according to the authors' study, the mean number of operations of all children (1.15) was lower compared with those of adults. This can be explained by the lower number of severe machinery injuries in the children, although there should be need more objective tools to evaluate the degree of the injuries more precisely.
In the youngest age group, 0 to 3 years old, the patients had open injuries in most cases (98.4%) and amputation and crushing injuries made up a major portion of the injuries. Although parents and guardians pay close attention to their young children, the clumsiness of the children's hand motions, poor judgement, and tremendous curiosity can put them in danger. They also showed a higher incidence of flexor injuries, because they usually want to grasp anything new, without concern for danger. On the other hand, the patients included in the oldest age group, 13 to 15 years, experienced closed injuries and extensor injuries more frequently. With increasing age, especially over the age of ten years, sport/recreational activities or physical conflicts constituted substantial portions of the causes of hand injuries. In addition, the increasing tendency toward physical conflict was not negligible. In this study, the injury level from the MP joint to the wrist was involved most frequently in the oldest age group (56.5%). Boxer's fracture is a common name for a fracture of the fifth metacarpal and received its name from one of its most common causes, punching an object with a closed fist [14]. Not only can the bones be fractured but the extensor tendon can be injured in a fistfight.
In the younger age groups of 0 to 3 years (52.5%), 4 to 6 years (44.9%), and even 7 to 9 years (31.9%), door-related injuries were the most common cause, and almost all door-related injuries occurred to the distal phalanx. As noted above, although parents or guardians pay close attention to their children, because of poor judgement and limited ability to avoid injury, prevention of distal phalanx injury is difficult. For this reason, distal phalanx injuries were most common in the younger age groups of 0 to 3 years (73.1%), 4 to 6 years (64.8%), and 7 to 9 years (48.1%). Doors are a well-known risk for children's fingers [61516]. In fact, more specific findings have been reported, such as which region of the door is more dangerous (the lock or hinge) or which door is more hazardous (the front door or the inner one) [17]. Door-related injuries can cause more severe injuries including crushing and amputation, which can cause not only an economic burden but also permanent disability. Efforts are needed to develop a successful preventive program.
In conclusion, the author conducted a retrospective study of hand injuries in children during the past 5 years, from 2010 to 2014. This study provides a comprehensive overview of the epidemiology of hand injuries in the pediatric population of Korea. Pediatric hand injuries occurred more frequently in males, and in the younger age groups, open and flexor injuries were more common than in the older age group patients. For prevention of door-related injuries, safe and protective measures should be developed and advertisements regarding the danger of doors at home should be considered.
Notes
No potential conflict of interest relevant to this article was reported.