Location of the umbilicus in Korean women and its changes after breast reconstruction with an ipsilateral pedicled rectus abdominis musculocutaneous flap
Article information
Abstract
Background
The umbilicus makes an important contribution to the natural appearance of the abdomen. To date, studies on its position in Korean women are lacking, and no standards have been established. The purpose of this study was to investigate the position of umbilicus in Korean women and to review changes in its position after ipsilateral pedicled rectus abdominis musculocutaneous (IP-RAM) flap.
Methods
This research consisted of two studies. In first study, 100 females who visited the emergency department with gastroenteritis between 2007 and 2011 were included. In second study, 40 women who underwent IP-RAM flap in the same period were included. Using abdominal computed tomography, we measured the distance between xiphoid process and umbilicus, represented by value a, and the distance between umbilicus and symphysis pubis, represented by value b. Thus, the location of the umbilicus was represented by the ratio a/b. The data were analyzed using Pearson correlation test and paired t-test.
Results
In study 1, the mean value of a/b was 1.07. Pearson correlation test revealed a significant correlation between age and a/b. In study 2, the mean value of a/b was 1.16 in preoperative measurements and 1.01 in postoperative measurements. The paired t-test showed a significant difference between preoperative and postoperative measurements, indicating cephalic migration of the umbilicus after surgery.
Conclusions
The natural position of the umbilicus showed caudal migration with aging. Additionally, in a comparison of preoperative and postoperative measurements in patients who underwent IP-RAM flap, cephalic migration of the umbilicus was observed after surgery.
INTRODUCTION
The umbilicus is the healed scar where the umbilical cord was cut at birth [1,2]. It is essential to the contour of the aesthetic appearance of the abdomen, and its absence leads to an unnatural abdominal appearance. An abnormally shaped or misplaced umbilicus may also draw undue attention to the central abdomen.
The umbilicus is assessed in terms of its shape and its location [3]. Many studies have sought to determine the ideal shape of the umbilicus [4-6]. Most studies have suggested that the most aesthetically pleasing umbilicus is generally small in size, T or vertical in shape, and with a superior hood or shelf. Normal values for umbilical shape by age and growth have been described in the Japanese population [7]. To date, many studies have been conducted on the shape of the umbilicus; however, few publications have presented ideal or normal data for the exact anatomical location of the umbilicus and the length of its stalk. Furthermore, such data have been generated using different landmarks for measurements, and many factors, such as age and past abdominal surgery, have been ignored.
The purpose of this study was to evaluate the location of the umbilicus in the Korean female general population, using a standardized definition, and to compare the preoperative and postoperative locations of the umbilicus in patients who underwent breast reconstruction using an ipsilateral pedicled rectus abdominis musculocutaneous (IP-RAM) flap. The authors hope that data describing the location of the umbilicus in the general population will serve as a reference for reconstructive surgeons performing neoumbilicoplasty or umbilicoplasty who review the authors’ description of umbilicoplasty during breast reconstruction using an IP-RAM flap.
METHODS
Subjects
For study 1, 100 female patients were randomly selected and equally divided into five groups by age (i.e., 20s, 30s, 40s, 50s, and 60s); these women visited the emergency department of Keimyung University Dongsan Medical Center from January 2007 to June 2011 for abdominal pain and were diagnosed with acute gastroenteritis without any other significant medical history. Each patient underwent enhanced abdominal computed tomography (CT). The exclusion criteria included patients with any disease or history of abdominal surgery that could alter the location of the umbilicus, including a cesarean section. A retrospective analysis of abdominal CT scans was performed to evaluate the location of the umbilicus.
For study 2, 40 patients without any history of a prior surgical procedure in the abdomen who underwent breast reconstruction using an IP-RAM flap by the senior surgeon (D.S.) during the same period of time were selected. These patients were divided into three groups by age, with eight patients in their 30s, 17 patients in their 40s, and 13 patients in their 50s. A retrospective analysis of abdominal CT scans was performed to compare the preoperative and postoperative locations of the umbilicus in the same manner as in study 1.
Surgical technique
The surgical technique is briefly described here. Flap elevation was performed with the patient in the supine position. When flap elevation was performed, the skin flap was elevated along suprafascial layer without damaging muscle fascia. Flap elevation was started from opposite side of pedicle, and stopped at about 1 cm over the linea alba. During dissection of the umbilical stalk, the vascular supply was maintained as much as possible by attaching sufficient soft tissue. Next, the anterior rectus sheath above the pedicle was longitudinally divided into three strips. Only the central strip was attached to the flap for the inset. The remainder of the medial and lateral fascia was sutured with 1-0 Vicryl with plication. Meshes and other materials (e.g., acellular dermal matrix or spacer) were not used in any cases. After the anterior rectal sheath was tightly sutured, the umbilicus was appropriately positioned and the rectal sheath was fixed with 4-0 Vicryl at 3, 6, and 9 o'clock.
CT measurements
All subjects underwent enhanced abdominal CT with 2- to 4-mm slice thickness. On the axial view, the location of the umbilicus was calculated by two fixed bony points, the xiphoid process and the symphysis pubis (Fig. 1). The xiphoid process was defined as the lowest level of the process that was easily palpated with the patient in the supine position; the symphysis pubis was defined as the highest level of the pubis (Fig. 2). The umbilicus was defined as the lowest point of the umbilical pit with the widest width. All measurements were obtained in millimeters. The measurements are represented as follows: distance between the umbilicus and the xiphoid process (a); distance between the umbilicus and the symphysis pubis (b); length of the umbilical stalk (s) (Fig. 3). The location of the umbilicus was represented by the ratio a/b (Fig. 4).
Definition of the xiphoid process on CT
The xiphoid process was defined as the lowest level of the process. (A) The last slide shows a bony calcification of the xiphoid process. (B) There was no calcification around the chest. CT, computed tomography.
Definition of the symphysis pubis on CT
(A) There was no connection between the bilateral pubic rami. (B) The first slide shows a connection between the rami. CT, computed tomography.
Definition of the umbilicus on CT
(A) The umbilicus was defined as the lowest point of the umbilical pit with the greatest width. (B) The length of the umbilical stalk, represented by the value s, was defined as the distance between the lowest point of the umbilical pit and the umbilical root. CT, computed tomography.
Schematic diagram of the measurements
The distance between the xiphoid process (x) and the umbilicus (u) is represented by the value a. The distance between the umbilicus (u) and the symphysis pubis (s) is represented by the value b. The location of the umbilicus is represented by the ratio a/b.
Study design
Before this study was conducted, the experimental design was approved by the Institutional Review Board of our hospital (DSMC 2017-08-039-002), and patients provided written consent for the use of their images. For study 1, the location of the umbilicus and the length of the umbilical stalk were compared between each age group. For study 2, every subject underwent enhanced abdominal CT preoperatively and at 6 months postoperatively. The location of the umbilicus, as defined by the a/b ratio, and the length of the umbilical stalk were compared between the preoperative and postoperative measurements. If a significant difference was found, we reexamined each distance from the umbilicus in the preoperative and postoperative images for confirmation.
Statistical analysis
Age and body mass index (BMI) were obtained for each patient. To determine the significance of between-group differences, we performed the Pearson chi-square test using SPSS version 19.0 (IBM Corp., Armonk, NY, USA). In study 1, correlations between age and a/b or s were analyzed using the Pearson correlation test and the Spearman correlation test. In study 2, the paired t-test was used to identify differences between preoperative and postoperative values of a/b and s.
RESULTS
Study 1
Demographics
A total of 100 female patients ranging in age from 20 to 66 years were equally distributed among the five age groups. The mean BMI was 21.4 kg/m2, and it did not differ significantly across the age groups.
CT measurements
The mean value of a/b for the 100 female patients was 1.07, and the mean value of s was 11.62 mm. The mean value of a/b was 1.03 in women in their 20s, 1.05 in those in their 30s, 1.08 in those in their 40s, 1.09 in those in their 50s, and 1.13 in those in their 60s. The paired t-test showed no significant differences in these values between the age groups (P=0.227). However, the a/b values tended to increase, indicating caudal migration, with older age. The Pearson correlation test showed a significant correlation between age and a/b (Fig. 5).
Correlation between age and a/b
There was a significant correlation between age and a/b. a/b, the ratio between distance from umbilicus to xiphoid process and from umbilicus to symphysis pubis.
The mean value of s was 13.24 mm in women in their 20s, 13.01 mm in those in their 30s, 10.54 mm in those in their 40s, 10.63 mm in those in their 50s, and 10.68 mm in those in their 60s (Table 1). There were no significant differences between any age groups and no clear age-related trends. The Pearson correlation test showed no significant correlation between age and s (Table 2).

Mean values of a/b and s for each age group
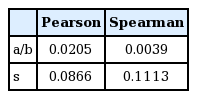
Pearson and Spearman correlation tests between age and a/b and s
Study 2
Demographics
Forty patients who underwent breast reconstruction using an IP-RAM flap were evaluated. The average age of the patients was 45.5 years (range, 28–60 years). The mean follow-up period was 29.4 months (range, 6–49 months). The mean BMI was 23.41 kg/m2 (range, 18.85–32.98 kg/m2), and there was no significant difference in BMI between the patients in studies 1 and 2.
CT measurements
The mean value of a/b was 1.16 in the preoperative measurements and 1.01 in the postoperative measurements. The paired t-test showed a significant difference between the preoperative and postoperative measurements, indicating cephalic migration of the umbilicus after the operation. The mean value of s was 9.28 mm in preoperative samples and 6.65 mm in postoperative samples. A significant difference was also found between preoperative and postoperative measurements. The mean value of a was 193.8 mm preoperatively and 183.5 mm postoperatively. There was a significant difference of 10.2 mm between the preoperative and postoperative values of a. The mean value of b was 169.2 mm preoperatively and 182.0 mm postoperatively. There was a significant difference of 12.9 mm between the preoperative and postoperative values of b (Table 3).
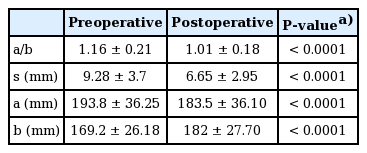
Analysis of preoperative and postoperative values
DISCUSSION
The umbilicus is composed of three components: the umbilical pit, stalk, and root [1]. The umbilical pit refers to a concave depression on the mid-abdomen, and the umbilicus helps define the medial abdominal sulcus and contributes to the shapely curve of the inferior abdomen. The umbilical stalk connects the umbilical pit and root, which contains the vascular network. The umbilical root is a specific portion of the linea alba. The umbilicus is evaluated in terms of its shape and location. Several studies have assessed the shape of the umbilicus. Most commonly, the umbilicus is T-shaped, followed by oval, vertical, horizontal, and distorted shapes, sequentially. Women who are heavier tend to have a larger, more transversely oriented umbilicus, whereas the umbilici of thinner subjects have a more oval or vertical orientation. Sakamoto et al. [7] studied the relationship between age and umbilical shape. Cavale and Butler [6] studied umbilicus shape preferences and found that an oval shape with superior hooding was preferred. The authors prefer a horizontally oriented umbilicus with superior hooding as the most natural shape. In this study, the authors focused on the location of the umbilicus.
The location of the umbilicus has been investigated in several studies that utilized different and unreliable standards. Baroudi [8] and Pitanguy [9] used the level of the umbilical pedicle as the surface transumbilical plane. However, massive weight changes might affect this relationship. A more exact location was given by Vernon, who positioned the umbilicus 2 to 4 cm below the waistline; however, this was also an inexact measurement made intraoperatively [10]. Hinderer [11] provided the best method in the literature, locating the umbilicus at 3 cm above the level of the anterior iliac crest, while Dubou and Ousterhout [12] used the value of 6.3 cm above the anterior iliac crest and at the topmost level of the iliac crest. Coetzee [3] considered the umbilicus to be located at the same level as the highest point of the iliac crest (i.e., at the third to fourth lumbar disc); this point was almost equidistant along the line joining the tip of the xiphoid process and the top of the symphysis pubis [1]. Abhyankar et al. [13] concluded that the umbilicus is situated around the midline plane, such that the ratio of the distance between the xiphoid process and the umbilicus to the distance between the symphysis pubis and the umbilicus is 1.6:1.
The present study is noteworthy in that it used fixed structures to measure the umbilicus. Because a variety of factors affect the position of the umbilicus, the authors chose the xiphoid process and symphysis pubis as fixed bony points for standard measurements. Because these standard points are easily palpated upon physical examination, they are also easily defined on abdominal CT scans. To ensure that reliable standards were used, the authors defined the xiphoid process as the lowest level of the process, the symphysis pubis as the highest level of the pubis, and the umbilicus as the umbilical pit area with the greatest width, using serial axial views with 2- to 4-mm thickness on abdominal CT scans. All measurements were obtained in millimeters. Study 1 evaluated the location of the umbilicus with a reliable standard in the general population, and study 2 evaluated changes in umbilicus location in patients who underwent breast reconstruction using an IP-RAM flap. In study 1, increasing age showed a tendency to be associated with umbilicus migration in the caudal direction. Before this study, the authors expected that a higher BMI might lead to caudal migration; however, the BMI values were not significantly different between any of the age groups [14]. Because most of the patients had a similar BMI, the authors could not confirm whether there was an association between BMI and the location of the umbilicus. This is an unfortunate limitation of our study. With osteoporosis resulting from aging, especially in female patients, the vertebral column shortens [15]. Thus, the upper body migrates downward. Additionally, increased skin laxity may play a role in caudal migration. In study 2, the umbilicus showed cephalic migration after surgery (Fig. 6). Although the authors attempted to keep in the umbilicus in a similar location during the operation, the postoperative results showed cephalic and operative site-directed migration. The authors suggest two explanations for this result. The first reason is the superior pull of the tightened skin flap after skin closure [16]. The second reason is technical error attributed to the placement of a fingertip underneath the abdominal flap aimed in a more cephalic direction when the surgeon marked a new umbilical point on the skin with the patient in the semi-Fowler position. Therefore, when the waist was bent, the umbilicus seemed to be low, but it should have been predicted that it would pull up when the waist was straightened. This should be kept in mind during flap surgery. There are several ways to reduce this type of error, including using a magnet suture on the umbilicus with a locating device pointing to the magnet or using a 3/0 silk marker stitch [17,18].
Changes in the umbilicus position postoperatively
(A, C) Preoperative picture, (B, D) postoperative picture. Cephalic migration was observed at 6 months postoperatively (arrow).
The authors assumed that patients who visited the emergency department for abdominal pain and were diagnosed with acute gastroenteritis were representative of the general population. Patients with any disease or abdominal surgery that altered the location of the umbilicus, including a cesarean section, were excluded. However, further obstetric history, recent weight changes, and peritoneal and abdominal muscle contracture due to abdominal pain were not considered because of limited information. Obtaining more detailed information would have resulted in more accurate evaluations [3]. Another limitation of this study is that the authors performed a plication suture to correct the operative site-directed traction of the umbilicus horizontally in some operations; however, the authors did not consider this in the analysis. The authors expected that the value of s would increase after the operation via operative site-directed tension. However, the mean value of s decreased in study 2, which can be explained by the above limitation. Although no information was available regarding plication sutures, the observation of cephalic migration is still meaningful because a horizontal vector made by traction and a plication suture affected the vertical vector to a certain degree.
Finally, all subjects underwent enhanced abdominal CT with 2- to 4-mm thickness. This 2- to 4-mm thickness was a factor that decreased measurement accuracy. If abdominal CT had been performed with thinner sections, the measurements might have been more accurate.
In conclusion, the mean value of a/b in 100 female patients was 1.07 and showed an increasing tendency (i.e., caudal migration) with age. The mean value of a/b was 1.16 in preoperative measurements and 1.02 in postoperative measurements in patients who underwent breast reconstruction surgery using an IP-RAM flap. This difference was significant, and demonstrated cephalic migration of the umbilicus after surgery.
Notes
No potential conflict of interest relevant to this article was reported.
Ethical approval
The study was approved by the Institutional Review Board of Keimyung University Dongsan Medical Center (IRB No. DSMC 2017-08-039-002) and performed in accordance with the principles of the Declaration of Helsinki. Written informed consents were obtained.
Patient consent
The patients provided written informed consent for the publication and the use of their images.