Experiences and attitudes toward aesthetic procedures in East Asia: a cross-sectional survey of five geographical regions
Article information

Abstract
Background
The demand for aesthetic procedures continues to grow globally, particularly in East Asian countries. The popularity of specific aesthetic procedures varies, however, depending on the particular East Asian geographical region being studied. This study aimed to evaluate the experiences of and attitudes toward aesthetic procedures in five East Asian countries/regions, including China, Japan, South Korea, Hong Kong, and Taiwan.
Methods
To recruit participants, an online questionnaire was designed and distributed on social media networks between May 2015 and March 2016. The statistical analysis was conducted using SPSS software, version 22.0.
Results
A total of 3,088 people responded (approximately 600 in each country/region). Of these, 940 participants (47.8%) responded that they had experienced at least one aesthetic procedure in the past. Taiwan had the highest number of participants who had experienced at least one procedure (264/940, 41%), with primarily non-surgical experiences. Only in South Korea did surgical cosmetic experiences exceed non-surgical cosmetic experiences (55.9% vs. 44.1%). The popularity of particular procedures and the motivation for undergoing aesthetic procedures varied by country.
Conclusions
The popularity of aesthetic procedures continues to evolve. Similar trends were observed across the East Asian regions; however, each country had its unique demands and preferences. The information provided by this study can help aesthetic plastic surgeons further understand the patients in their corresponding region, customize their practice, and develop the requisite skills.
INTRODUCTION
The popularity of surgical and non-surgical aesthetic procedures continues to grow with no indication of slowing down. According to data published by the International Society of Aesthetic Plastic Surgery (ISAPS) in 2020, more than 24 million surgical and non-surgical aesthetic procedures were performed worldwide in 2019 [1]. Specifically, the aesthetic procedure industry in East Asia has shown immense potential and is currently the fastest-growing region in the global market, with a compound annual growth rate predicted to be approximately 6.05% from 2019 to 2027 [2,3].
The popularity of procedures varies depending on the geographic region [4]. In North and South America, breast augmentation and liposuction were reported to be the two most often performed procedures, whereas eyelid surgery was the most common surgical procedure performed in Japan and Taiwan [5]. Botulinum toxin and hyaluronic acid injections were found to be the most popular non-surgical procedures globally, with the exception of Japan where laser hair-removal was the most popular non-surgical procedure [1,5,6]. The differences across geographical regions are likely related to ethnicity, culture, economy, facial characteristics, and/or social media exposure, as reported in a study by Allergan that included 8,000 women across 16 countries [7].
East Asia is known for its long history and unique culture. Compared to Western countries, Asia was late to start the development of aesthetic procedures because of traditional values and negative social attitudes towards modifying the human body. In the early 1990s, South Korea started the pursuit of beauty across socio-economic classes together with advances in surgical techniques. To date, South Korea is considered the aesthetic surgery “Mecca” of Asia [8-10]. Subsequently, this wave knocked on the doors of neighboring China, Thailand, and Taiwan [11,12]. Initially, aesthetic procedures in East Asia were influenced by Western procedures. However, with a greater understanding of the unique ethnic features of Asian populations (including anatomy and social expectations), modified approaches to Asian aesthetic procedures were developed. Surgical techniques and procedures were tailored to suit Asian consumers, including Asian blepharoplasty, Asian rhinoplasty, jaw and zygoma reduction surgery, and selective neurectomy for calf reduction [8,9].
Despite the increasing popularity of aesthetic procedures in East Asia, there is a paucity of studies comparing Asian countries to better understand how the consumers in those countries view the concept of aesthetic surgery. The aim of this study was to assess and evaluate consumer ideas and motivations, decision-making factors, and experiences with aesthetic procedures in five major East Asian countries/regions, including China, Japan, South Korea, Hong Kong, and Taiwan.
METHODS
Recruitment of participants
Participants were recruited from the general public using social media networks (e.g., Facebook, KakaoTalk, Line, QQ, and WeChat). The questionnaire was distributed to randomly selected participants between May 2015 and March 2016. The target number of participants was at least 600 from each country/region.
Questionnaire
The questionnaire was designed on Google Forms [13]. The original form was developed in traditional Chinese and Korean. After numerous modifications and pilot surveys, the questionnaire was finalized and translated into simplified Chinese (Diào Chá Pai was used), Cantonese (for Hong Kong), and Japanese.
The questionnaire consisted of three parts (Supplemental Table 1). The first part gathered participants’ demographic information, including nationality, gender, and experiences with aesthetic procedures. The aesthetic procedures were grouped into surgical procedures, injectable therapies, or laser therapy. Injectable and laser therapies were considered non-surgical procedures.
The second part of the questionnaire contained questions on previous experiences with aesthetic procedures. Depending on the individuals’ previous experience, participants were divided into an experienced group or a non-experienced group. The experienced group was then asked to state the type of procedure, motivation to undergo the procedure, financial source for the procedure, and the type of medical institution they selected for having the procedure done. Participants in the non-experienced group were asked if they had ever considered having an aesthetic procedure in the past and the reason they elected not to have the procedure done.
The third part consisted of general questions related to concepts of beauty and acceptance of aesthetic procedures. Participants were asked how they would perceive a family member or friend who was undergoing an aesthetic procedure and whether they would accept their decision to do so.
Statistical analysis
Participants were asked to answer all questions in the survey. Participants who completed fewer than 80% of the questions or gave irrational answers were excluded from the study. In this study, since a freely available online questionnaire was used, the response rate was not readily obtainable.
The statistical analysis was conducted using SPSS version 22.0 (IBM Corp., Armonk, NY, USA). Differences in proportions for dichotomous variables were tested with the Fisher exact test, and differences in the values of continuous variables were tested with the independent-sample Mann-Whitney U test, as appropriate. All P-values were two-sided and the significance level was set at P < 0.05.
RESULTS
Demographics
In total, 3,088 questionnaires qualified for evaluation: 626 from China, 604 from Japan, 592 from South Korea, 626 from Hong Kong, and 640 from Taiwan (Table 1). There were 1,878 female respondents and 1,210 male respondents (Table 1). Across all countries, more females responded to the questionnaire than males. The mean age of respondents included in our study was 29.7 years and 72.4% of the participants were between 20 and 40 years old. The distribution of participants according to country, sex, age, employment status, and marital status is shown in Fig. 1 and Table 1. Because some participants did not answer all of the questions in the survey, the total number of responses varied from question to question. For example, 84 participants (2.72%) did not respond to the question on marital status.
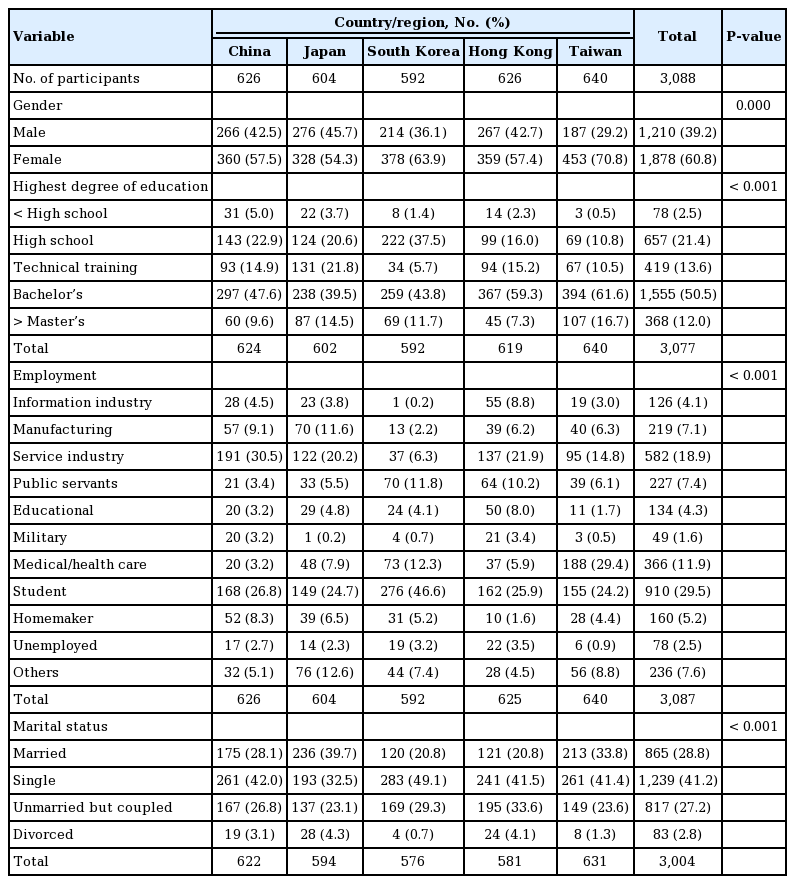
Demographic data of the participants
Distribution of participants by age.
Previous experience of an aesthetic procedure
Among all participants, 940 (30.4%) had experienced at least one aesthetic procedure in the past. Of those 940, 556 participants (59.15%) experienced non-surgical procedures and 384 participants (40.85%) underwent surgical procedures (Table 2).
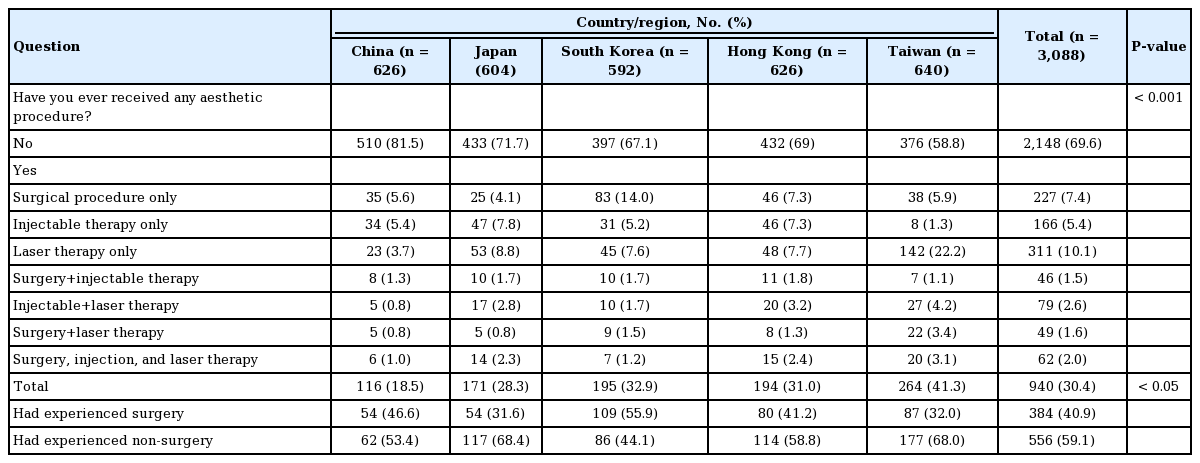
Responses to the question asking, “Have you ever received any aesthetic procedure?”
Participants who experienced aesthetic procedures
Of the participants who had experienced aesthetic procedures, 263 (39.1%) ranged in age from 31 to 40 years old, comprising the largest group (P < 0.05) (Table 3, Fig. 2). The variation in the number of participants who had experienced aesthetic procedures in each country was statistically significant. Taiwan had the most people who had experienced aesthetic procedures (n = 264, 41.6%), while China had the fewest (n = 116, 18.5%) (P < 0.05) (Table 2).
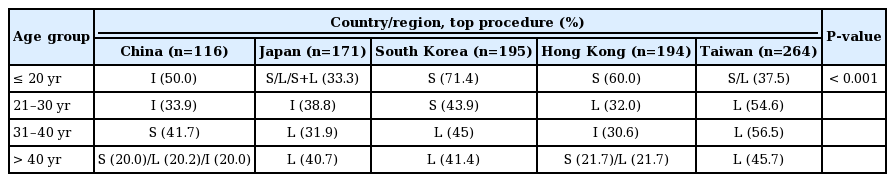
Preferences for the aesthetic procedure by participants’ age per country/region
Percentage of experienced aesthetic procedure participants per age group.
Type of procedures
The type of procedure that participants underwent varied by country (Table 2). In South Korea, more people had undergone surgical procedures (55.9%) than non-surgical procedures. In all other countries/regions, non-surgical procedures were more popular, especially in Japan (68.4%).
Within the surgical procedures, upper blepharoplasty was the most popular procedure across all countries except South Korea, where the most popular surgical procedure was rhinoplasty. In Taiwan, rhinoplasty was the second most popular procedure, while facial contouring procedures were the second most popular in China and Hong Kong. In South Korea, the second most popular surgical procedure was facial contouring, followed by upper blepharoplasty. The procedures commonly performed in Western countries such as liposuction and cosmetic breast surgery were relatively less popular in the East Asian countries (Table 4).
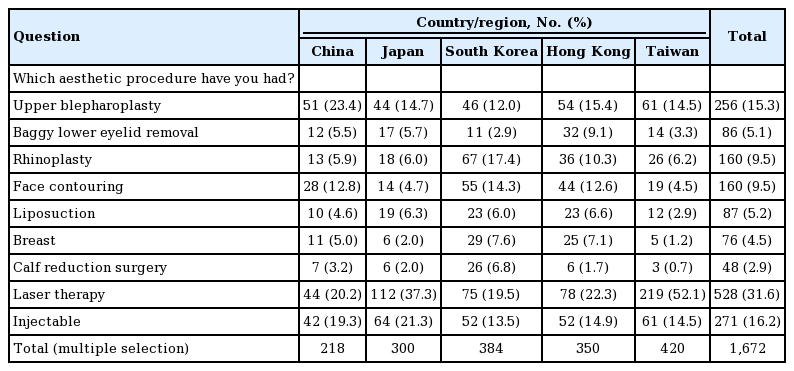
Aesthetic procedures experienced by nationality, including non-surgical procedures
Motivation for undergoing aesthetic procedures
Overall, 64.5% of the participants who had experienced aesthetic procedures selected internal factors, such as self-investment or enhancement of self-confidence, as their motivation for undergoing plastic surgery (Table 5). External factors such as peer pressure, advertising/celebrity influence, or recommendations by family/friends were selected by 28.1% of respondents. Commencement of a new career was selected by 7.4% as the main motivation. As for the individual country/region, South Koreans focused more on self-investment and confidence (92.5%), whereas Japanese were the most easily influenced by their peers or external factors.
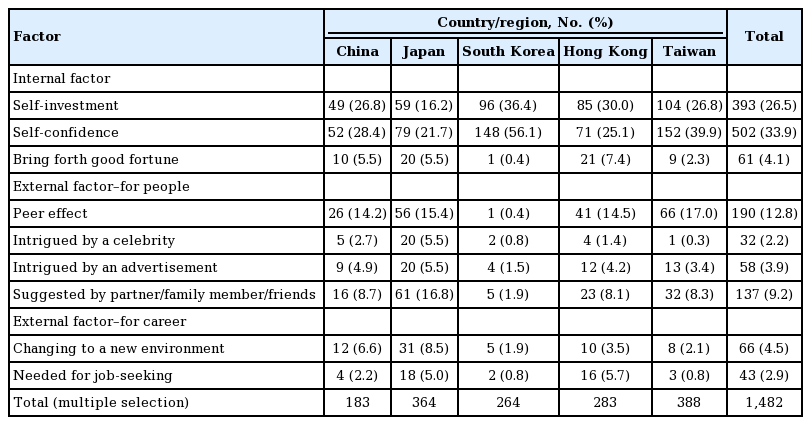
The motivation for aesthetic procedures among participants who had experienced the procedures, classified by internal factors and external factors (for people or for one’s career)
Participants who had not experienced an aesthetic procedure
Reasons for not having aesthetic procedures
The reasons for not having aesthetic procedures were categorized into five groups. Among those who had not experienced an aesthetic procedure, 29.4% selected that they were satisfied with their appearance. This was the top reason selected in all countries, followed by concerns regarding side effects or complications from the procedures (23.16%). Other reasons selected were financial factors, concerns with perceptions of others, and age factors (perceiving themselves as either too young or too old for aesthetic procedures).
Procedures considered
When respondents in the non-experienced group were asked to choose a type of aesthetic surgical procedure they would consider or wish to have done, upper blepharoplasty and liposuction both ranked high (n = 227, 20.3% and n = 231 20.6%, respectively), followed by rhinoplasty (n = 210, 18.7%) and face contouring (n = 187, 16.7%) (Table 6).
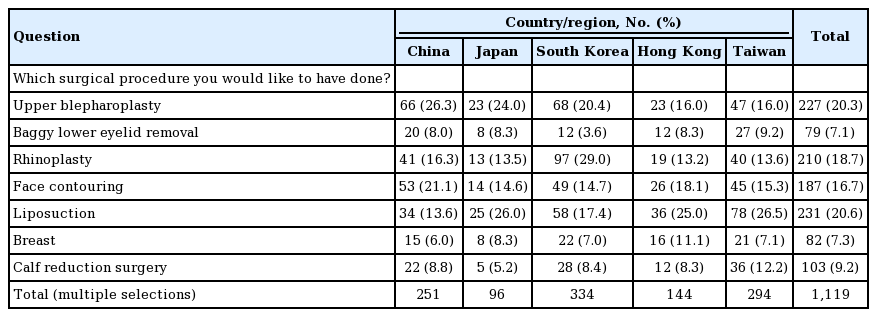
Responses to the question asking, “If you decided to receive an aesthetic surgical procedure, what would you have done?”
Choice of medical institution and medical practitioner
An aesthetic clinic was the most popular type of medical institution chosen by respondents in South Korea, Hong Kong, and Taiwan. In China, however, 47% of participants chose to have their aesthetic procedure performed by a “familiar doctor,” which included a doctor or clinic recommended by friends or family members (Fig. 3).
Medical institution preferences.
All participants were asked whether they understood or acknowledged the difference between a plastic surgeon and an aesthetic or cosmetic doctor. Only 23.8% of the participants answered yes (P < 0.01). Furthermore, they were asked if it was important for them whether the medical practitioner was a plastic surgeon or an aesthetic doctor, and interestingly, 67.3% of them reported that it was important to them (P < 0.01) (Table 7).
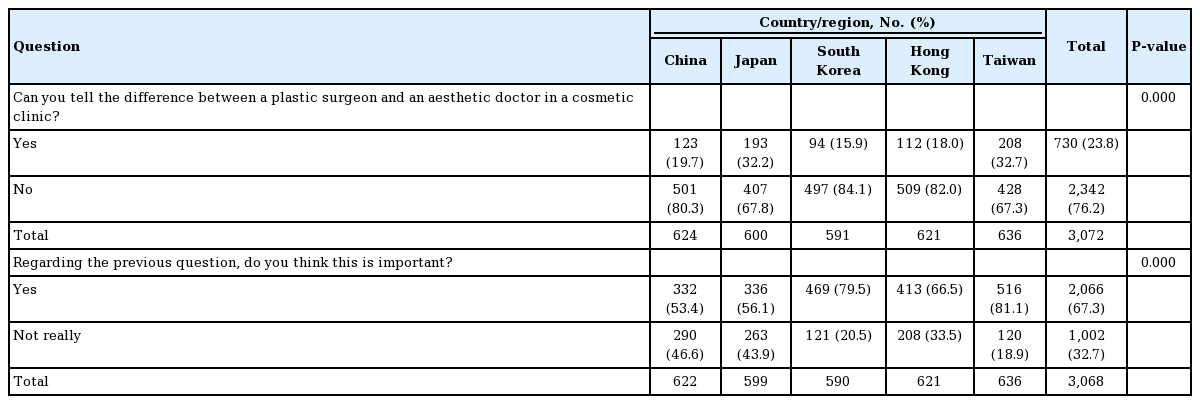
The percentage of participants who could tell the difference between a plastic surgeon and an aesthetic doctor, and the perceived importance of that difference
Dealing with unsatisfied results–what action will you take?
Of the participants who had experienced aesthetic procedures, 48.3% of respondents reported that they would not return to the same clinic for further treatment if they were unsatisfied with their results, followed by 32.7% who would warn their family and friends of their experience, and 29.5% who would consider taking legal action against the practitioner and/or institution (Table 8). South Korea had the highest percentage of respondents choosing to take action in more aggressive ways. Japan and Taiwan had the lowest percentage of respondents to this question. Participants who experienced aesthetic surgery were more likely to take aggressive action than those who had non-surgical procedures.
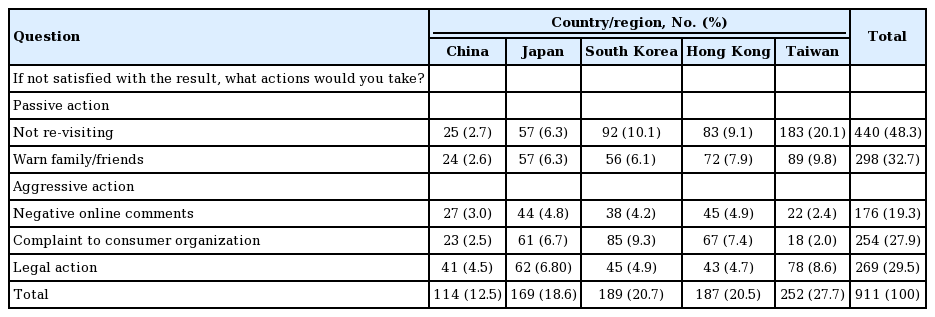
The course of action participants who experienced aesthetic procedures would take if they were faced with unsatisfactory results
Attitudes toward partners who received an aesthetic procedure were also analyzed. Results showed that Japan had the highest percentage of non-acceptance toward a partner receiving an aesthetic procedure even if the participant himself/herself had experienced an aesthetic procedure. In comparison, participants in other countries/regions who had experienced aesthetic procedures themselves were accepting of a partner receiving an aesthetic procedure. Similar results were noted for their children (Supplemental Tables 2, 3).
DISCUSSION
The total number of global aesthetic procedures increases every year. However, there is wide variation in the most frequently performed procedures, depending on the country/region [1]. Our study focused on the ethnic region of East Asia and assessed the current trends in aesthetic procedures among the different countries/regions. Although they belong to the same geographic region, each country/region had its own trends in popular aesthetic procedures, gender distribution, and age groups that undergo these procedures, based on the differing cultural and social expectations.
In this study, over 70% of the participants who had experienced an aesthetic procedure were in the age range of 21–40 years old (Table 3, Fig. 2). Blepharoplasty and rhinoplasty have been the most common procedures in East Asia since 2010. According to data from 2017, their popularity was still high, particularly in Japan and Thailand [1]. This study showed blepharoplasty to be the most popular surgery in China, Japan, Hong Kong and Taiwan, whereas in South Korea, rhinoplasty is the leading procedure. This difference could be due to the fact that Koreans tend to have lower nasal profiles when compared to other ethnic groups in the East Asian region. One study did report shorter nose height and broader nose width in 20–39 years old Korean women than in Japanese women [14]. We believe that these characteristics led to the popularity of rhinoplasty in South Korea, as clients seek a higher and narrower nasal dorsum and a more projected tip [15,16].
Although China, Hong Kong, and Taiwan are three different regions, they are all ethnically Chinese. However, respondents showed differing preferences in aesthetic procedures. In surgical procedures, China reported more cases of upper blepharoplasty, while Hong Kong reported more cases of lower blepharoplasty. Facial contouring and breast procedures were similarly popular in China and Hong Kong, but less so in Taiwan. Taiwan reported more laser procedures than surgical procedures, but the percentage of injectable procedures was similar among the three countries/regions.
In Taiwan and Japan, non-surgical aesthetic procedures outnumbered surgical aesthetic procedures. Participants from Japan and Taiwan who had experienced aesthetic procedures reported having had laser or injectable therapy in the past (68.4% and 68.0%, respectively). These non-surgical procedures are attractive because they are relatively non-invasive, have fewer complications, are less expensive, and have shorter recovery times compared to surgical procedures. In Taiwan, the total number of board-certified plastic surgeons in 2021 was around 800. However, more than 30,000 doctors were working as aesthetic/cosmetic doctors, working either full- or part-time as providers of cosmetic non-surgical or surgical procedures [17,18]. The same situation has been noted in South Korea [19,20]. The high number of aesthetic clinics is likely a result of poor reimbursement by the medical insurance systems and gray areas in the legal systems that allow doctors without certification to practice in this field. One reason for the popularity of cosmetic clinics may be related to the customer’s concept of ideal beauty. In Asian culture, women prefer a lighter skin tone because they believe that a whiter complexion can mask other beauty imperfections [21]. The popularity of laser skin therapies in Taiwan in particular was noted to be much higher than in other countries in this study.
Of the participants who had not experienced aesthetic procedures, 20.6% had an interest in liposuction. ISAPS global statistics also revealed that liposuction procedures increased by 22.2% worldwide in 2019, as compared with 2015 [1]. The increased interest in liposuction may be due to increases in obesity and people seeking healthier body images. In addition, there were increases in other non-invasive procedures that aim to reduce fat [22-24]. From this study and current trends, it appears that these non-invasive fat-reduction procedures will also become more widespread over time.
When choosing a medical institution for their aesthetic procedures, 72% of participants from South Korea, 54% from Hong Kong, and 43% from Taiwan reported that they would choose aesthetic clinics over a medical center or visiting a “familiar doctor.” Popularity of the clinic, accessibility, privacy, financial cost, and word-of-mouth recommendations were reported as important factors. These results are consistent with Won’s study in 2004, which reported that 71% of South Korean college students selected aesthetic clinics for aesthetic procedures [25-27]. In contrast, the Chinese participants tended to prefer a “familiar doctor,” with references from peers/acquaintances, rather than relying on the reputation of the institution.
The study noted that there was a higher tendency towards medical litigation in China, Japan, and South Korea. Taiwan had lower rates of legal action (P < 0.005). In this study, the characteristics of consumers who were most likely to engage in medical disputes were: (1) female sex, (2) between ages 21–30 or older than 50, and (3) experiencing economic stress making it necessary to borrow money for an aesthetic procedure (Supplemental Table 4). Other characteristics such as educational status, marital status, and medical institution were not shown to be significant in this study. This differs from a previous study in Taiwan which reported that being over 30 years old, married/divorced, and without economic stress were significant characteristics of those likely to litigate [28]. Both studies reported no significant differences between hospitals and clinics. Plastic surgeons are among the specialties that most frequently face malpractice claims (13%) [29]. Legal action can be avoided or more easily resolved if consumers are fully informed, with a thorough explanation of all possible risks, before giving consent for a procedure or operation [30].
Despite the large cohort of participants in this study, there were several limitations. First, although the online questionnaire enabled the collection of a large number of responses, it also came with multiple variables. Despite simplifying the questions to encourage participants to complete the questionnaire, there may still have been questions that were difficult to understand by some participants, contributing to possible error. Second, difficulties were encountered with the distribution of the questionnaire. Each country had its own social media regulations and each social media platform had its own target populations. This may have limited or skewed our distribution of participants. Selection bias was difficult to avoid. For example, geographical factors (i.e., urban vs. rural, eastern vs. Western parts of the country/region) could not be fully understood, especially in a large country like China. The results may have bias and not be representative of the entire country. The best number of participants to represent each country/region was debatable as well, since the population of each was substantially different. There may also have been bias from the different social media platforms. For example, Facebook and Instagram have different target populations, and people not active on social media were automatically excluded. Third, the quality of the data collected was also subject to certain limitations. The questionnaire was multiple-choice and participants were encouraged to choose the answer that best described their response, possibly oversimplifying the results. Moreover, it was not possible to collect personal information on participants, which might have provided more comprehensive information about each specific population group. Information such as cultural background, religion, and the degree to which an individual spends time and/or money on beauty-related products and services in their daily life could be valuable data. Perhaps, with the continued popularity of social media and increasing internet coverage, some of these limitations can be overcome. Finally, an online questionnaire is a reliable method for collecting large amounts of data from participants; however, the response rate is difficult to determine since it is almost impossible to track how online questionnaires propagate on the internet.
In conclusion, the popularity of aesthetic procedures continues to evolve around consumers’ cultural and religious beliefs, social media influences, and personal concepts of “beauty.” Aesthetic industries are built around consumer demands and even though trends across East Asia are similar, each country/region has its own unique practices and advancements to cater to these demands.
Notes
Conflict of interest
Tommy Nai-Jen Chang is an editorial board member of the journal but was not involved in the peer reviewer selection, evaluation, or decision process of this article. No other potential conflicts of interest relevant to this article were reported.
Ethical approval
This survey was anonymous. Individuals’ sensitive information was not included, so the requirement to obtain written informed consent was waived. Subjects were not vulnerable individuals such as students.
Author contribution
Conceptualization: TN Chang. Data curation: SH Kwon, AT Hsu, S Koide, KH Cho, E Tanaka, YW Cheon. Formal analysis: CH Lee, HY Chen. Methodology: CH Lee. Project administration: WW Lao, TN Chang. Visualization: S Koide. Author of original draft: SH Kwon. Writing, review, and editing: SH Kwon, S Koide, WW Lao, TN Chang. All authors read and approved the final manuscript.
Supplementary material
Supplemental Table 1. Questionnaire in English. Supplemental data can be found at https://doi.org/10.5999/aps.2020.02565
Supplemental Table 2. The attitude toward his/her companion to receive aesthetic procedure, in experienced group and nonexperienced group, respectively. Supplemental data can be found at https://doi.org/10.5999/aps.2020.02565
Supplemental Table 3. The attitude toward his/her child to receive aesthetic procedure, in experienced group and non-experienced group, respectively. Supplemental data can be found at https://doi.org/10.5999/aps.2020.02565
Supplemental Table 4. The characteristics of experienced participants who will take aggressive action comparing with relative action, when they have unsatisfied result. Supplemental data can be found at https://doi.org/10.5999/aps.2020.02565